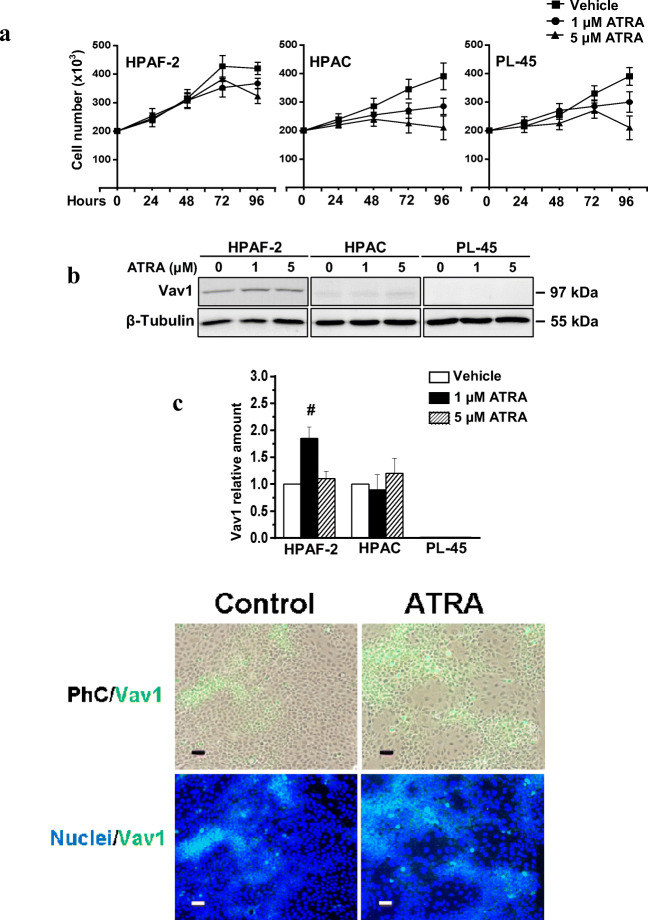
Fig. 3.
ATRA up-modulates Vav1 in HPAF-2 cells. In (A) the number of viable HPAF-2, HPAC and PL-45 pancreatic cancer cells cultured in the presence of different concentrations of ATRA for the indicated times. In (B) representative Western blot analysis with the reported antibodies of lysates from HPAF-2, HPAC and PL-45 cells grown for 96 h in the presence of ATRA at the indicated concentrations. In (C) levels of Vav1 as deduced from the densitometry of immunochemical bands normalized with β-Tubulin, used as internal control for equivalence of loaded proteins. Error bars indicate ± SD from a triplicate experiment. # P < 0.05. In (D) representative microscopy images of HPAF-2 cells grown for 96 h on glass dishes in control conditions or in the presence of 1 μM ATRA, subjected to immunocytochemical analysis with the anti-Vav1 antibody (green staining) and counterstained with DAPI (blue staining). Merged images of Vav1 staining with phase-contrast (PhC/Vav1) or with nuclear staining (Nuclei/Vav1) are shown. Bar: 50 μm

