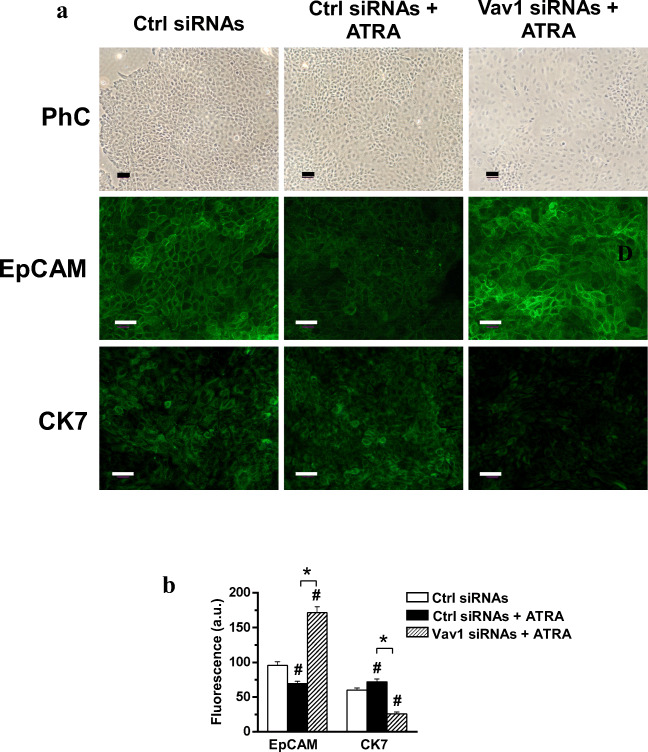
Fig. 4.
Vav1 sustains the ATRA induced re-differentiation of HPAF-2 cells. (A) Representative fluorescence microscopy images of HPAF-2 cells transfected with scramble siRNAs (Ctrl siRNAs) or with siRNAs specific for Vav1 (Vav1 siRNAs), grown for 96 h in the presence of 1 μM ATRA and subjected to immunocytochemical analysis with anti-EpCAM and anti-CK7 antibodies. Bar: 50 μm. (B) Fluorescence intensity of digitized images calculated by the ImageJ software. All the data are the mean of three separate experiments performed in triplicate ±SD. # P < 0.05 versus control; * P < 0.05 between bars

