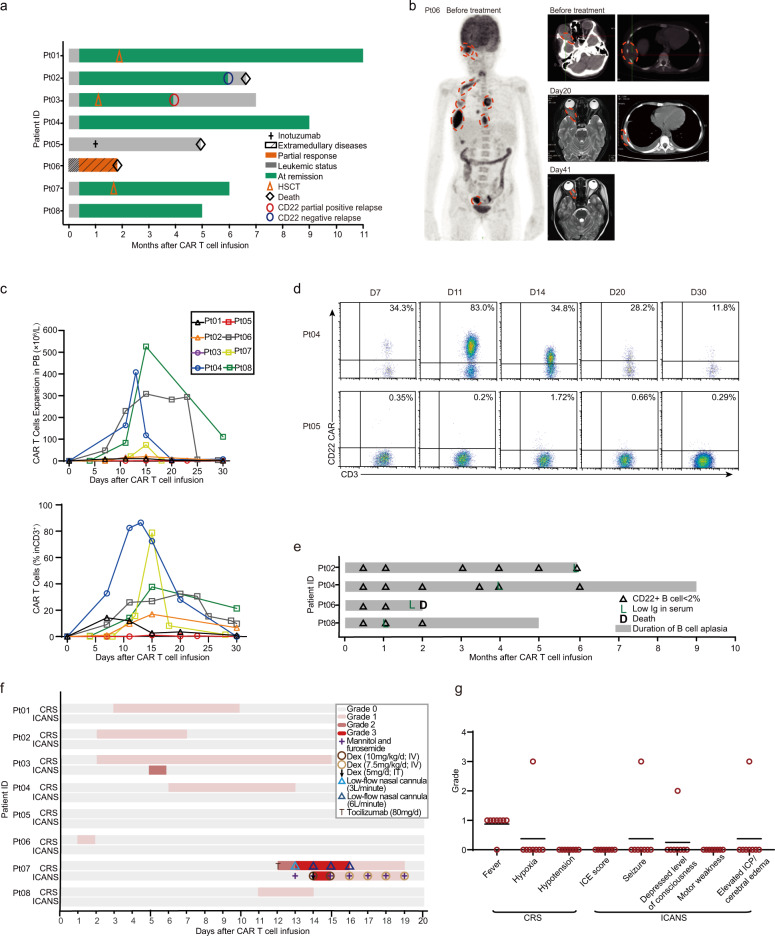
Fig. 2. Clinical efficacy and safety of CD22-CARFH80 T cell therapy.
a Swimmer plot showing the clinical responses, response duration, and outcome in individual patients treated with CD22-CARFH80 T cells. HSCT, hematopoietic stem cell transplantation. b Images showing the retreatment extramedullary disease detected by position emission tomography (PET), the reduction of intracranial mass detected by magnetic resonance imaging (MRI), and the reduction of chest wall mass detected by computed tomography (CT) during CAR T cell treatment in patient 6. The red dotted circle indicates the border of a leukemia mass. c Absolute number of CAR T cells (above panel) and the percentage of CAR T cells among CD3+ T cells (below panel) in the peripheral blood of eight patients who received CD22-CARFH80 T cell therapy. d Representative dot plot, detected by flow cytometry, showing the presence of CD22-CARFH80 T cells among CD3+ T cells in the peripheral blood of two patients, including Pt 4 who achieved complete remission and Pt 5 who did not respond to the therapy. e Swimmer plot showing the duration of B cell aplasia in the bone marrow and hypogammaglobulinemia in four patients who achieved complete remission but received no further treatments. Serum immunoglobulins and bone marrow non-malignant B cells were determined by immunoturbidimetry and flow cytometry, respectively. f Swimmer plot showing the grade, duration, and management CRS and ICANS in each patient. The color in the swimmer lane indicates the existence of a specific grade of CRS or ICANS at a specific time point during CAR T cell treatment. IT intrathecal injection IV intravenous injection CRS Cytokine-release syndrome ICANS immune effector cell-associated neurotoxicity syndrome. g Symptoms of CRS and ICANS in individual patients during CD22-CARFH80 T cell therapy. Horizontal lines indicate mean values of the grade of specific symptoms.

