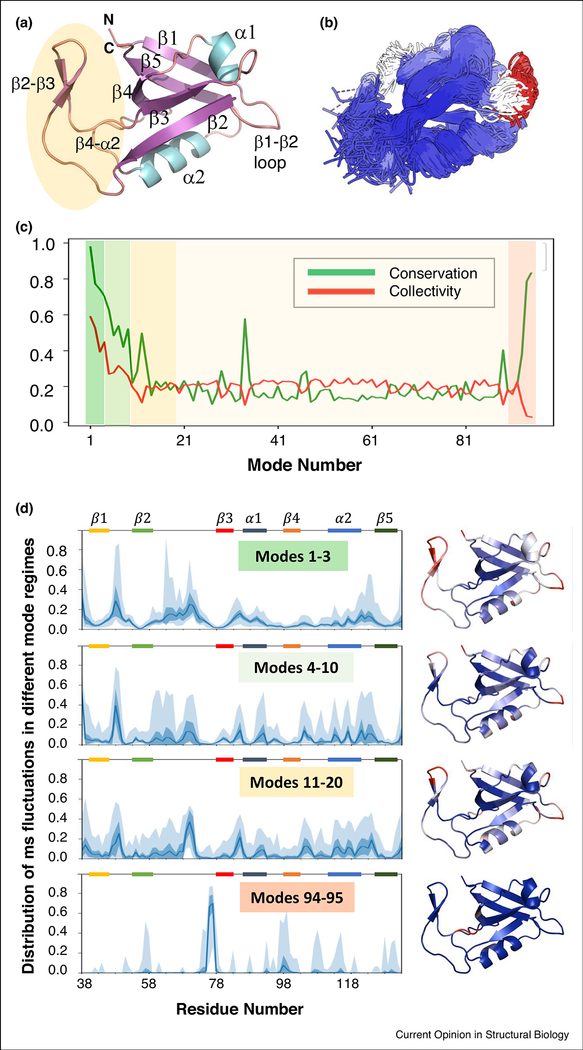
Figure 2: An example signature dynamics analysis of the PDZ domain family illustrates the roles of different mode regimes.
(A) The representative PDZ domain from CATH [55]: sorting nexin-27 (SNX27) bound to PTHR PDZ-binding motif (PDB: 4Z8J) [56], which is critical for PTHR signaling and bone development [56,57]. (B) Overlay of the ensemble of PDZ domain family structures, colored by the extent of structural variation with the most variable regions in red, structurally conserved parts in blue, and regions with intermediate variability in white. The ensemble was aligned using mappings from DALI [58] and refined using RMSD filters of 1.0 Å to reduce redundancy and 10.0 Å to exclude outliers. (C-D) SignDy analysis of this ensemble. (C) Conservation of GNM modes (green curve, based on pairwise overlaps between matched modes of family members) shows high conservation of global modes (dark green shaded; 1 ≤ k ≤ 3), less conservation for intermediate/fast modes (light yellow), and conservation again for the very fast modes (dark orange shaded). LTIF modes show a mixed behavior: the slow portion (light green shaded) shows a moderate conservation and intermediate portion (yellow shaded) is less conserved like the fast modes. The red curve shows the degree of collectivity, which shows anticorrelation with the green curve throughout the spectrum except for global and slow modes. (D) Mean-square (ms) fluctuations (MSFs) of residues for different frequency windows (left) and corresponding color-coded structures (right). In the left panels, the dark blue curves represent the average MSF profile of the ensemble, blue shades represent the standard deviation, and the light blue area displays the range. Global and LTIF modes are highly collective and activate the β2-β3 loop, followed by β1-β2 and α2-β5 loops; the highest frequency modes 94–95 point to the core region (at β3 N-terminal end) as a center of energy localization.

