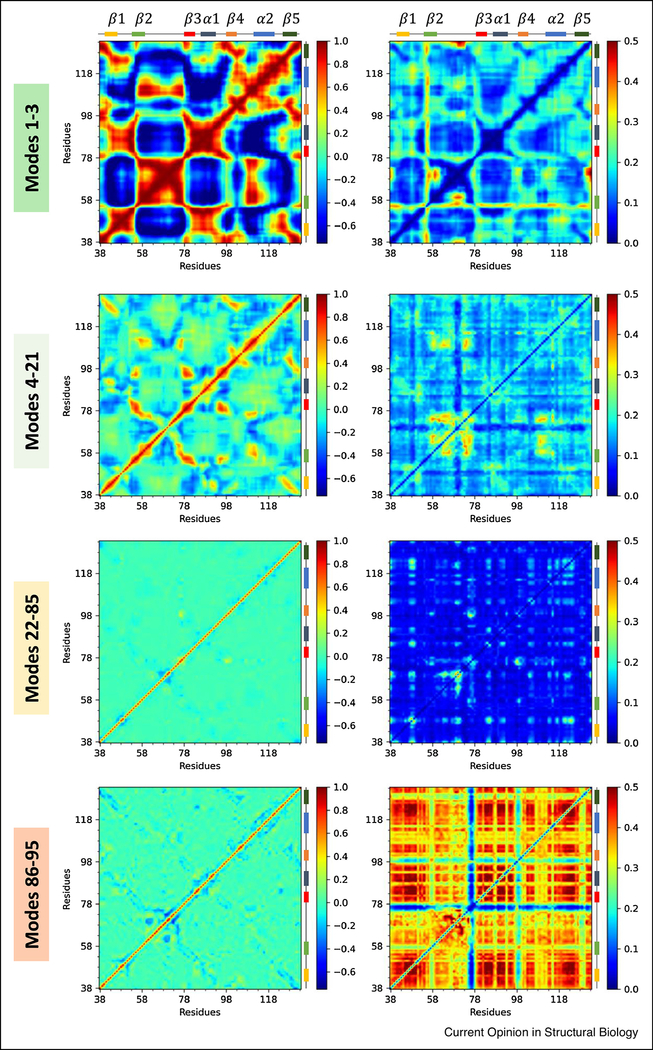
Figure 3: Cross-correlations between residue movements and their variance, in different frequency regimes, illustrated for the PDZ domain family.
Four panels show the mean (left) and standard deviation (right) values for the cross-correlations between residue movements, corresponding to global, LTIF, intermediate-to fast and very fast regimes, from top to bottom. The left matrices are colored from anti-correlated in dark blue to positively correlated in dark red via uncorrelated in green. The right matrices are colored from less variable in dark blue to more variable in dark red. Note the strong correlations in the global modes (top left) and the strongly coupled variations in cross-correlations in the fastest modes (bottom right), which show the concerted movements in the soft modes and the necessity for co-varying residue motions in the fastest/stiffest modes.

