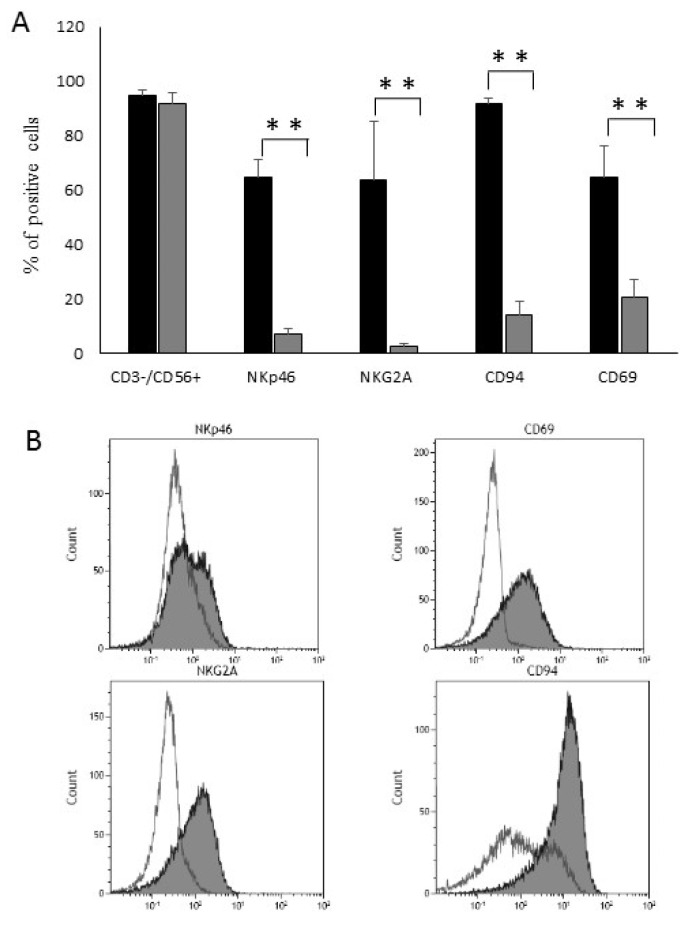
Figure 3.
Phenotypic evaluation. (A) Analysis of surface antigen expression on control NK cells and memory-like NK cells obtained with protocol B. Results are expressed as the means and standard deviation (SDs) of the receptor surface expression percentages, ** p < 0.01. (B) Representative results showing the up-modulation of surface antigen expression from day 0 (white profiles) to day 7 (grey profiles).

