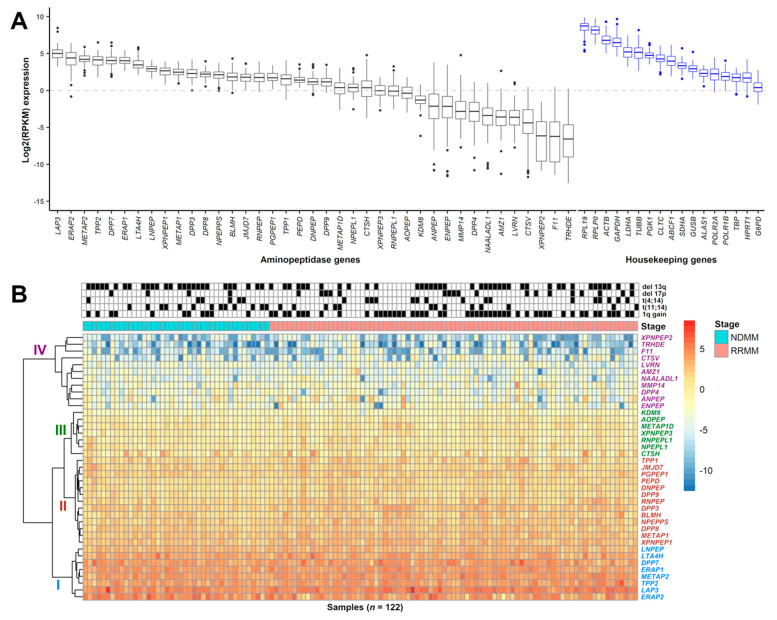
Figure 1.
Expression of aminopeptidase gene family in MM patient CD138+ cells. (A) Boxplot showing the log2(RPKM) expression of 39 aminopeptidase and 17 housekeeping genes from 122 MM samples (NDMM (n = 41), RRMM (n = 81)) taken from 99 different patients. Genes are ranked based on median expression values. (B) Heatmap showing the hierarchical clustering of aminopeptidase gene expression, with group I (blue) containing genes with the highest and group IV (magenta) containing genes with the lowest level of expression. Groups II (red) and III (green) contain genes with an intermediate level of expression. Sample cytogenetics (del 13q, del 17p, t(4;14), t(11;14), 1q gain) are indicated above the heatmap. Disease stage indicates whether the sample was from NDMM (shown as cyan; samples on the left) or RRMM (pink; samples on the right). RPKM: reads per kilobase of transcript per million mapped reads; MM: multiple myeloma; NDMM: newly diagnosed multiple myeloma; RRMM: relapsed/refractory multiple myeloma.

