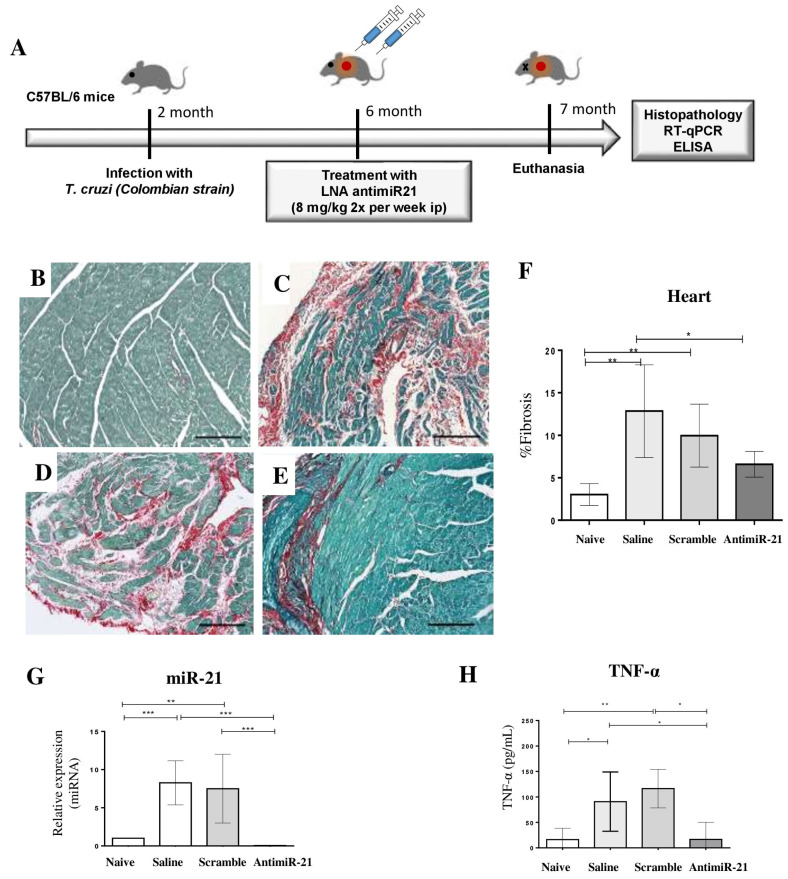
Figure 6.
Effects of the treatment with LNA-anti-miR-21 inhibitor in chronic chagasic mice. (A) Experimental design of the in vivo experiments. (B–E) Representative images of cardiac sections (ventricles) stained with Sirius Red. The following experimental groups were evaluated: naïve (B), saline (C), LNA scrambled (D), and LNA-anti-miR-21 (E). Scale bars = 100 μm. (F) Quantification of fibrosis area. (G) Heart samples from mice treated with LNA-miR-21 inhibitor were used to evaluate the miR-21 expression levels by RT-qPCR two weeks after treatment. (H) serum levels of cytokine TNF-α evaluated by ELISA. Data are represented as mean ± SEM. n = 8 per group. ANOVA with Bonferroni comparisons. * p < 0.05. ** p < 0.01. *** p < 0.001.

