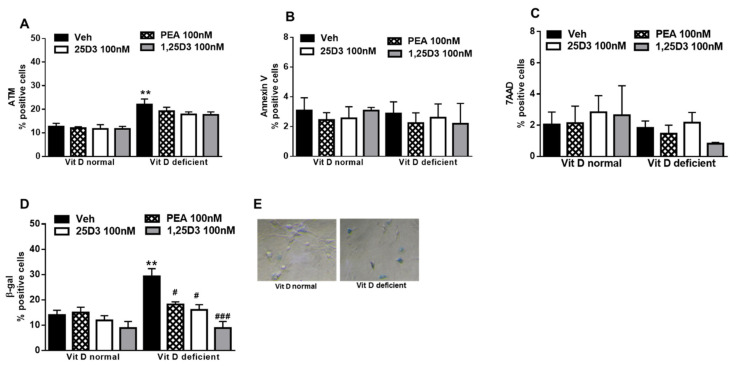
Figure 3.
(A) Percentage of ataxia-telangiectasia mutated (ATM)-positive normal or deficient VitD primary microglia cells. (B) Percentage of Annexin V-positive normal or deficient VitD microglia cells. (C) Percentage of 7AAD normal or deficient VitD microglia cells. (D,E) Percentage of β-Gal in normal or deficient VitD primary microglia cells. Cells were treated with vehicle (DMSO 0.001%, 24 h) or 25D3 or 1,25D3 or PEA (100 nM, 24 h). Values are represented as mean ± SEM (cells samples n = 6–8), ** indicates statistically (p ≤ 0.001) significant difference vs. vehicle-treated VitD-normal cells; # and ### indicate statistically (p ≤ 0.05 and p ≤ 0.0001) significant difference vs. vehicle-treated VitD-deficient cells. Two-way ANOVA, post-hoc Tukey’s.

