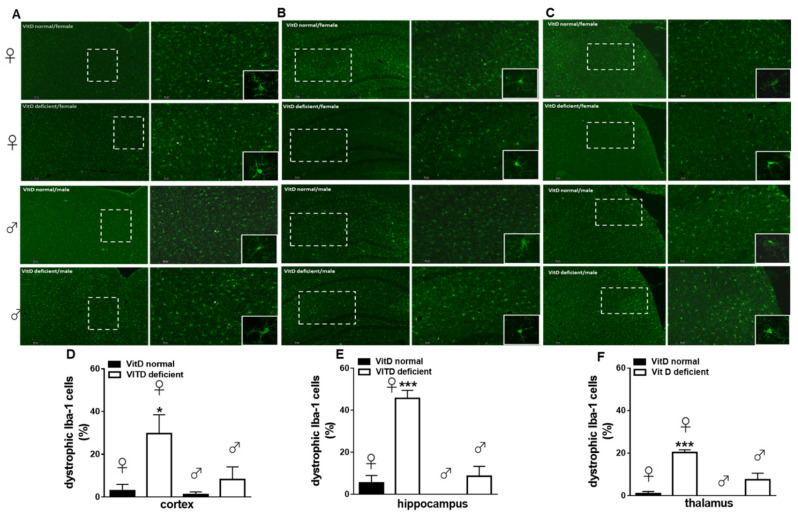
Figure 6.
Representative images and quantitative analysis of the dystrophic Iba-1 positive cells in the cortex (A,D), hippocampus (B,E), and thalamus (C,F) of VitD-normal or VitD-deficient female or male mice. Squares represent crop of a single Iba-1 positive profile to highlight the morphology. Data are expressed as the percentage of dystrophic microglia cells vs. the total cells number for each group (n = 3 mice per group). * and *** indicate statistically (p ≤ 0.05 and p ≤ 0.001) significant difference vs. related control. Two-way ANOVA post hoc Tukey. Scale bars 5 and 20 µm.

