Figure 3.
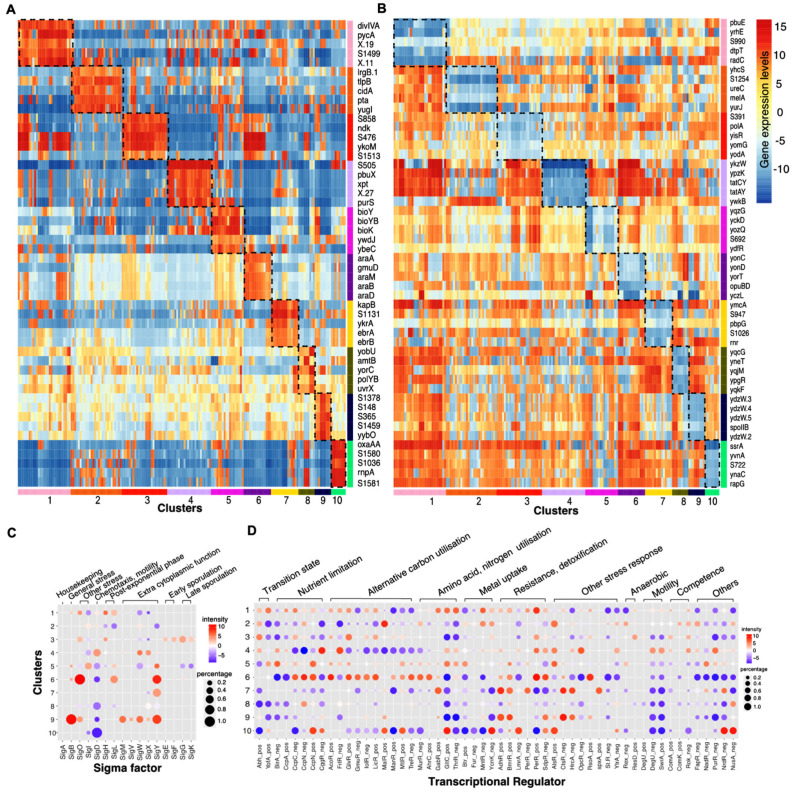
Cellular state inference for clusters. (A) Top5 (by p-Values) upregulated genes that are specific for each cluster. (B)) Top5 (by p-Values) downregulated genes that are specific for each cluster. (C) Inferred activities of selected sigma factors in each cluster. (D) Inferred activities of selected transcriptional regulators (TR) in each cluster. Dot colours represent the average intensity with red indicating activation while blue indicating repression. Dot sizes represent the percentage of samples within the cluster that sees the significant upregulated or downregulated expressions in genes targeted by that sigma factor or regulator. The sigma factor or regulator is activated (repressed) in a sample if the average expression of the genes regulated is higher (lower) than the 70th (30th) percentile expression in the whole transcriptome. The inferred activities for the full list of sigma factors and TRs are given in Supplementary Table S3E.

