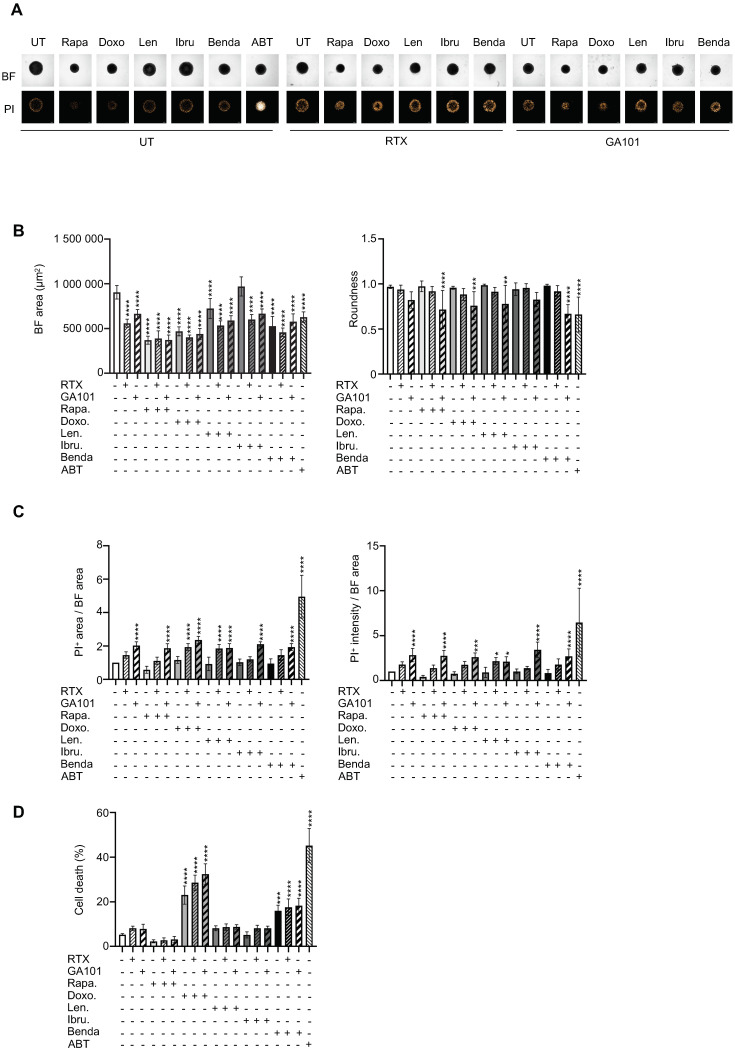
Figure 4.
Drug response of ULA-MALC after 3 days of treatment. ULA-MALC were seeded at 2500 cells and treated or not (UT) after 3 days of culture with rapamycin (Rapa, 10 nM), doxorubicin (Doxo, 0.1 µM), lenalidomide (Len, 5 µM), ibrutinib (Ibru, 500 nM), bendamustine (Benda, 10µg/mL) in combination or not with rituximab (RTX) or GA101 (10 µg/mL). ABT-199 (ABT) at 100 nM was used as the positive control. Figures represent results obtained after 3 days of treatment and are representative (pictures) or the mean ± SD (graphs) of 3 independent experiments each comprising 5 individual ULA-MALC. p values: **** = p < 0.0001, *** = p < 0.0005, ** = p < 0.01 and * = p < 0.05. (A) Visualization of global morphology (BF) and propidium iodide (PI) labeling by 2D imaging, 5× magnification and scale: 200 µm. (B) Bright field (BF) area and roundness determined by 2D imaging analysis with the specific macro developed (see the Methods section). Results represent the mean ± SD. (C) Cell death quantification after PI labeling by 2D imaging on whole ULA-MALC. Results represent the mean ± SD of PI area in relation to BF area (left) and PI intensity in relation to BF area (right), all normalized to the untreated condition. (D) Cell death quantification by flow cytometry in dissociated ULA-MALC. Results represent the mean ± SD of the percentage of cell death (7AAD+).

