Figure 5.
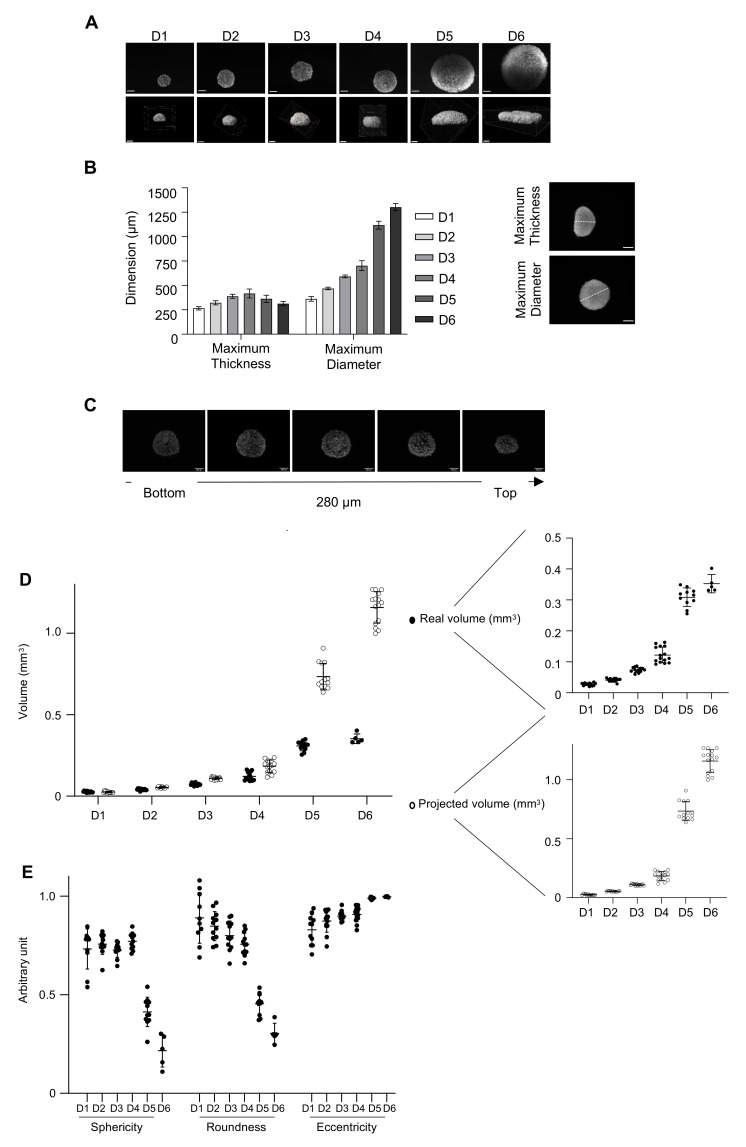
Three-dimensional characterization of ULA-MALC. ULA-MALC were cultured at a 2500 cell seeding density and observed at different times (D = day) by selective plane illumination microscope (SPIM) microscopy. (A) Pictures of center (upper panel) and 3D representation (lower panel) of ULA-MALC cultured during the indicated times (5× magnification, scale: 200 µm). These pictures are representative of 12–15 individual ULA-MALC (depending on the condition). (B) Quantification of maximum thickness and maximum diameter of ULA-MALC cultured during the indicated times. Histograms represent the mean ± SD of 12–15 individual ULA-MALC (depending on the condition). Insert, representative images of ULA-MALC at day 3 of culture (5× magnification, scale 200 µm). The white line represents the maximum thickness (upper) and maximum diameter (lower) used for quantification. (C) Ki67 labeling visualization by 3D imaging in ULA-MALC at day 3 of culture. Images were extracted from SPIM z-stack, from the bottom (left) to the top (right) of the MALC with a difference of 70 µm between them. Magnification 5×, scale: 200 µm. These pictures are representative of 2 independent experiments comprising 3 individual ULA-MALC. (D) Projected and real volumes of ULA-MALC after different days (D) of culture. Results are presented on global (left) or individual graphs (right) and are expressed by the mean ±SD of 5–15 individual ULA-MALC (depending on the condition). (E) Sphericity, roundness and eccentricity measured on ULA-MALC cultured during the indicated times (D = day). The graph represents the mean of each parameter ± SD of 5–15 individual ULA-MALC (depending on the condition).

