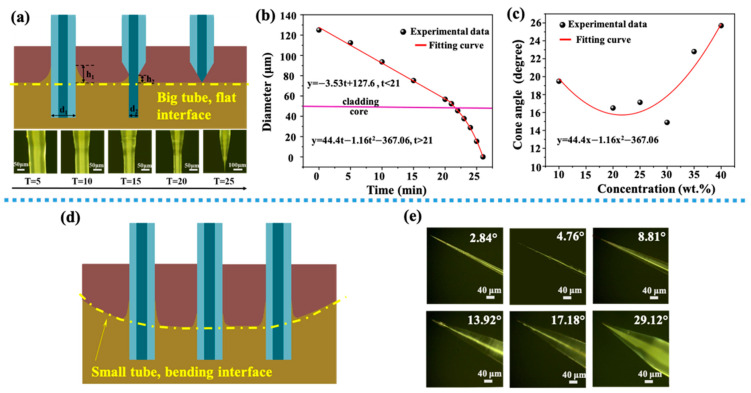
Figure 2.
(a) Schematic diagram of optical fiber corrosion process (a flat interface), images on the second row show the tip of the fiber at different etching time, with a 5-min interval; (b) the relationship between the fiber diameter and the etching time, the red lines are fitting curves for two different stages separated by a horizontal pink line (interface between core and cladding). (c) The relationship between HF acid concentration and final cone angle, the red line is a quadratic fitting curve of experimental data. (d) Schematic diagram of the meniscus formed by the optical fiber at different positions in a small centrifuge tube (a bending interface). (e) Optical images of tapered optical fibers with different angles.

