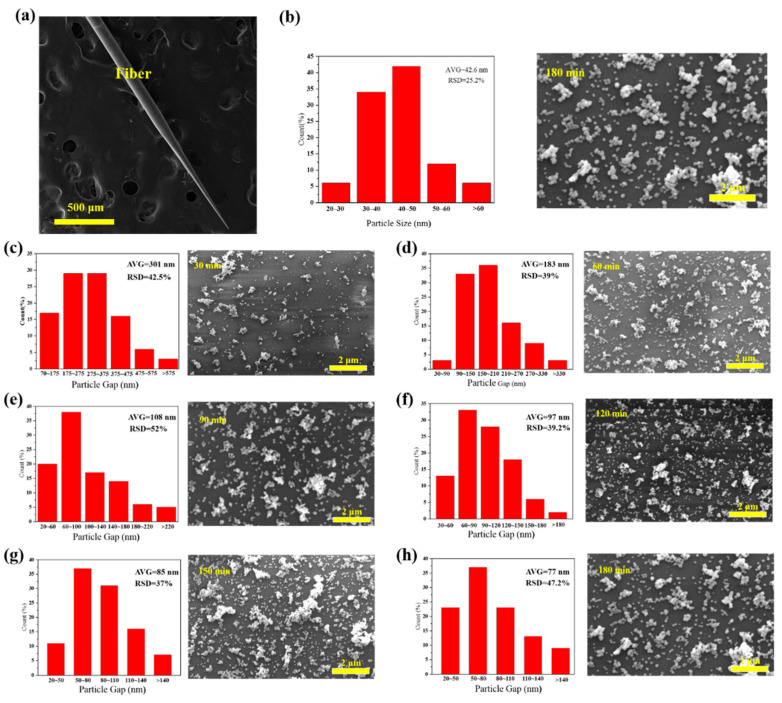
Figure 4.
(a) SEM (Scanning Electron Microscope) image of a fiber surface-enhanced Raman scattering (SERS) probe (cone angle of 4°); (b) size distribution for AgNPs decorated tapered fiber samples and (c–h) SEM images of different AgNPs deposition time at surface of the tapered fiber tip and corresponding spacing distribution and for 30 min, 60 min, 90 min, 120 min, 150 min and 180 min deposition time, respectively.

