Figure 3.
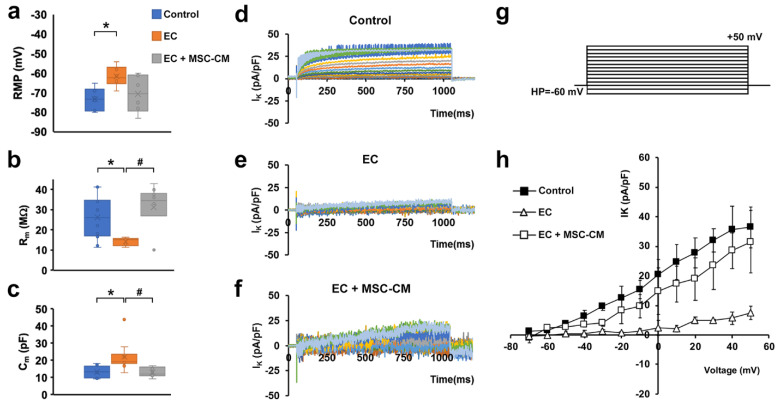
Membrane passive properties and K+ currents of single myofibers from control EDL muscles, EDL muscles damaged by ex vivo forced eccentric contraction (EC) and EDL muscles damaged by EC in the presence of bone marrow-mesenchymal stromal cell (MSC) conditioned medium (EC + MSC-CM). (a–c) Membrane passive properties. (a) Resting membrane potential (RMP) values (in mV) resulted −73.2 ± 5.7 in control myofibers (n = 6), −61.5 ± 5.1 in EC myofibers (n = 6) and −70.5 ± 9.5 in EC + MSC-CM myofibers (n = 6). One-way ANOVA with Bonferroni’s correction gave p = 0.03; F = 4.46 > Fcrit = 3.68; df = 17. (b) Membrane resistance (Rm) values (in MΩ) were 26.34 ± 10.6 in control myofibers (n = 12), 14.3 ± 2.0 in EC myofibers (n = 5) and 31.3 ± 11.6 in EC + MSC-CM myofibers (n = 10). One-way ANOVA with Bonferroni’s correction gave p = 0.018 F 4.7 > Fcrit = 3.4; df = 26. (c) Membrane capacitance (Cm) values (in pF) were 13.28 ± 3.3 in control myofibers (n = 7), 22.1 ± 8.5 in EC myofibers (n = 10) and 13.1 ± 2.7 in EC + MSC-CM myofibers (n = 9). One-way ANOVA with Bonferroni’s correction gave p = 0.017; F = 4.8 > Fcrit=3.4; df = 25. Values are mean ± SD; * p < 0.05 vs. control; # p < 0.05 vs. EC. N is the number of myofibers included in the statistical analysis. (d–g) Time course of representative K+ currents (IK) evoked in response to the voltage pulse protocol depicted in (g) obtained from a typical (d) control, (e) EC and (f) EC + MSC-CM myofiber. Current amplitudes are normalized to cell capacitance and are reported in pA/pF. (h) I/V plot of the overall current values in control (n = 7), EC (n = 6) and EC + MSC-CM (n = 7). All of the data from EC myofibers are statistically different from control starting for voltage values more positive than −40 mV. Data from EC + MSC-CM myofibers are significantly different from control ones for −30 mV values, and to EC myofibers for voltage values more positive than −20 mV. The error bar is visible when its size exceeds that of the symbol. (Two-way ANOVA, statistically significance for p < 0.05, not indicated in this panel for clarity).

