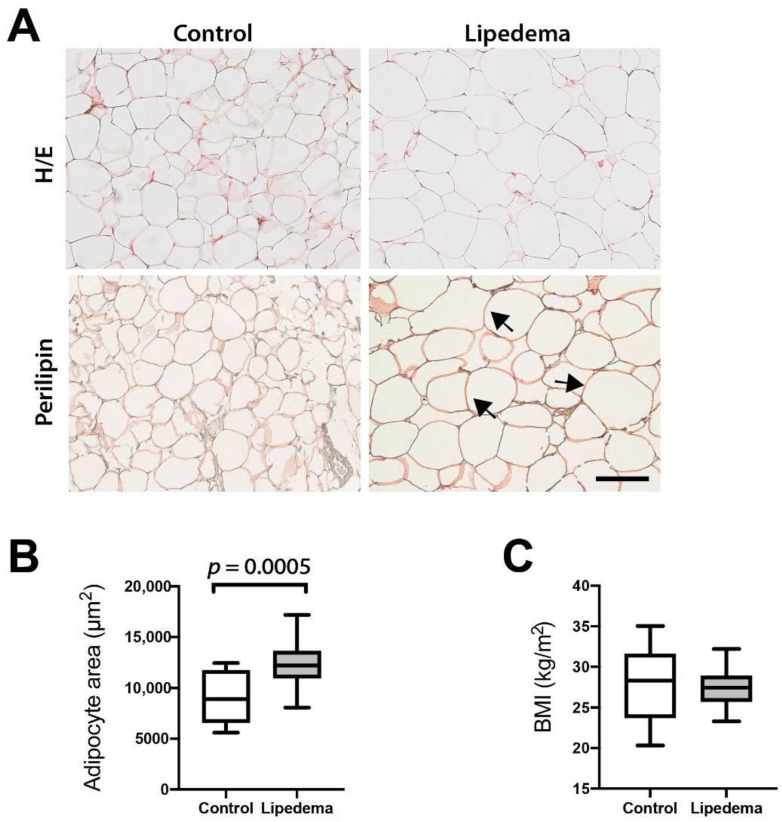
Figure 1.
Adipocyte hypertrophy in lipedema. (A) Hematoxylin/eosin (H/E) and Perilipin immunostaining of paraffin-embedded adipose tissue demonstrating that even the largest adipocytes remain perilipin positive. The arrows indicate the large perilipin-positive adipocytes. Scale bar: 100 μm. (B) Quantification of the adipocyte size using the hematoxylin/eosin sections reveals adipose tissue hypertrophy. (C) The body mass index (BMI) values of the control and lipedema patients appear comparable. N (Control): 10 patients and N (Lipedema): 20 patients. The p-values indicate the statistical significance in comparison to the control (two-tailed Student t-test).

