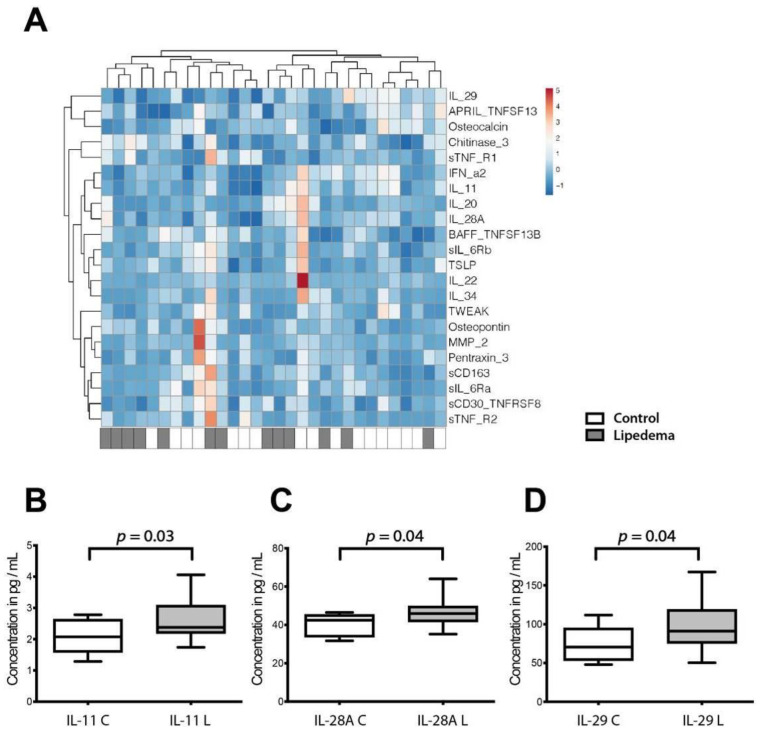
Figure 4.
Inflammatory cytokine and chemokine profile of lipedema and control patients. (A) Multiplex immunoassay using serum samples from lipedema and control patients. Heat map showing log 2-fold changes in concentration of 22 cytokines/chemokines normalized by mean value of control samples. (B–D) Concentration of IL1 (B), IL28A (C), and IL29 (D) were significantly increased in the serum of lipedema patients. N (Control): 10 patients and N (Lipedema): 20 patients. The p-values indicate the statistical significance in comparison to the control (two-tailed Student t-test).

