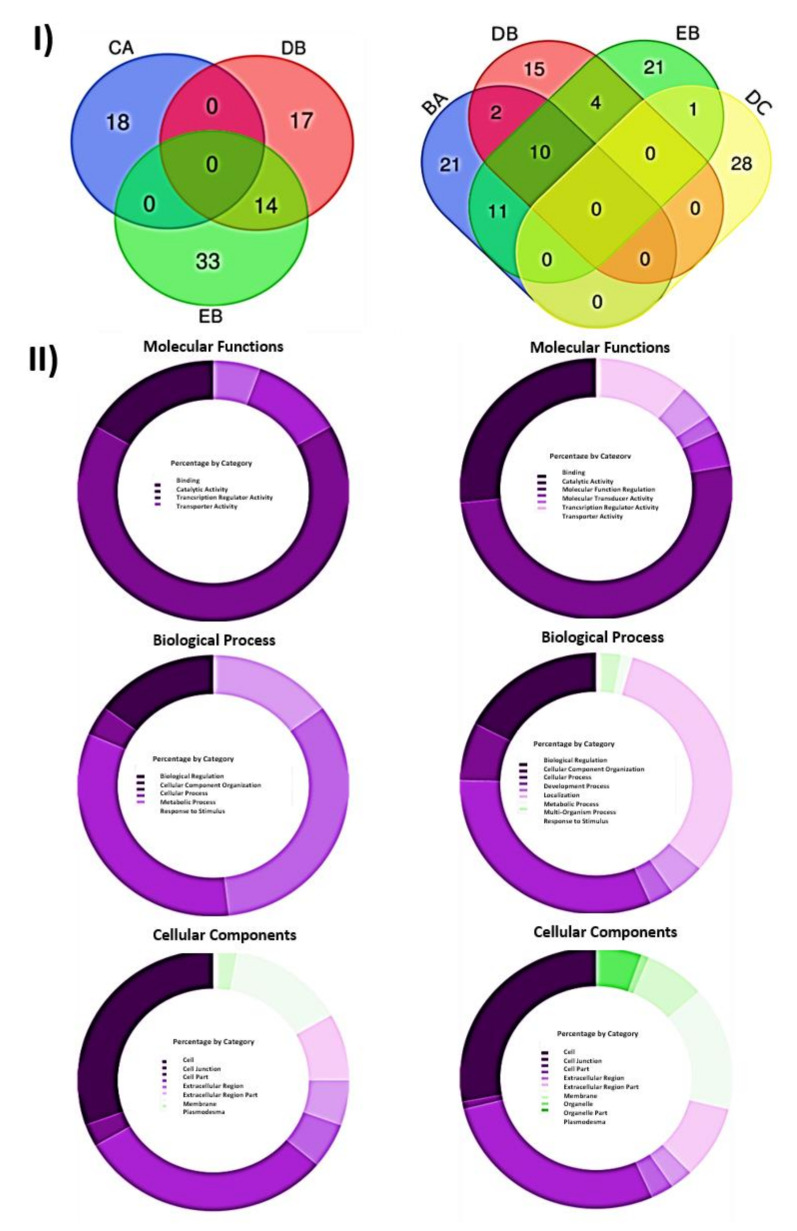
Figure 3.
(I) Analysis of DEGs associated with grafting (CA vs. DB vs. EB) (left) and inoculation (BA vs. DB vs. EB vs. DC) (right) effects: control healthy “GF305” peach rootstocks; PPV-infected “GF305” rootstocks showing severe sharka symptoms; “GF305” peach rootstocks grafted with healthy “Garrigues”; PPV-infected “GF305” rootstocks showing sharka symptoms grafted with healthy “Garrigues”; healthy “GF305” peach rootstock grafted with healthy “Garrigues” which were later inoculated with PPV at the end of the first cycle of evaluation. “Garrigues” almond samples grafted onto healthy and inoculated “GF305” rootstocks. (II) GO term categories obtained by PANTHER for DEGs associated with grafting (left) and inoculation (right) effects. Diagram shows percentage of GO term categories showing the total of each domain for DEGs “Cellular Components”, “Biological Processes” and “Molecular Functions” domains.

