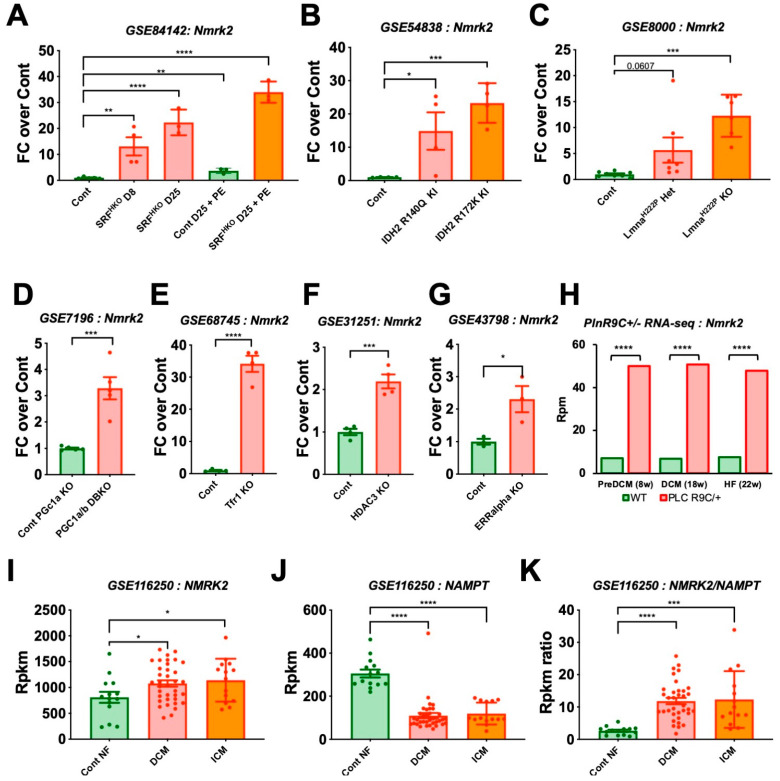
Figure 1.
Nmrk2 is upregulated in different models of dilated Cardiomyopathy (DCM). Public Table 4. month-old adult mice analyzed at day (A) 8 and D25 after cardiac-specific deletion of the Serum Response Factor gene (SRFHKO mutant), or D25 with phenylephrine administration (80 mg/kg/day, 15 days), and controls (n = 3 to 5 mice/group) [9]. (B) Adult mice analyzed at 1 month after conditionally-activated expression of isocitrate dehydrogenase 2 mutants (IDH2) R140Q and R172K (n = 4 mice/group) [22]. (C) A-type lamin Lmna H222P homo-/heterozygous mutants at 10 weeks of age, an early pre-symptomatic stage (n = 6 to 8 mice/group) [23]. (D) 2 to 3-month-old adult mice doubly deficient for peroxisome proliferator-activated receptor γ coactivators Pgc-1α (global KO) and Pgc-1β (cardiac-specific KO, 1 month after deletion) versus Pgc-1α KO (n = 4 mice per group) [25]. (E) 10-days-old pups with cardiac-specific deletion of the transferrin receptor 1 gene (Tfr1) (n = 4 mice/group) [26]. (F) 6-week-old mutants deleted for histone deacetylase 3 (HDAC3). Deletion occurred 7 days after birth (n = 4 mice/group) [27]. (G) 2 to 3-month-old adult mice lacking estrogen-related receptor alpha (ERRalpha) (n = 3 mice/group) [28]. (H) Adult mice expressing a missense mutation (p.Arg9Cys) in phospholamban (PLNR9C/+) analyzed at early asymptomatic pre-DCM stage (8 weeks), DCM stage (18 weeks) and HF stage (22 weeks). RNA was extracted from purified cardiomyocytes, pool of 3 mice/group, p values are indicated as from supplementary table in reference [7]. (I–K) RNA-seq data from human patients, non-failing (NF, n = 14) controls, DCM (n = 37) and ischemic cardiomyopathy (ICM, n = 13) [31]. (I) NMRK2 and (J) Nicotinamide phosphoribosyl transferase (NAMPT) expression level; (K) NMRK2 on NAMPT expression ratio. Dots are values for each individual in A to I. Data are shown as mean fold change over mean control value (colored bars) +/- SEM (error bars) in I to K. GEO dataset reference is indicated in each panel. Statistics: Only comparison of each mutant group against the control groups were planned. t-test: *, p ≤ 0.05; **, p ≤ 0.01 ***; p ≤ 0.001; ****; p ≤ 0.0001.

