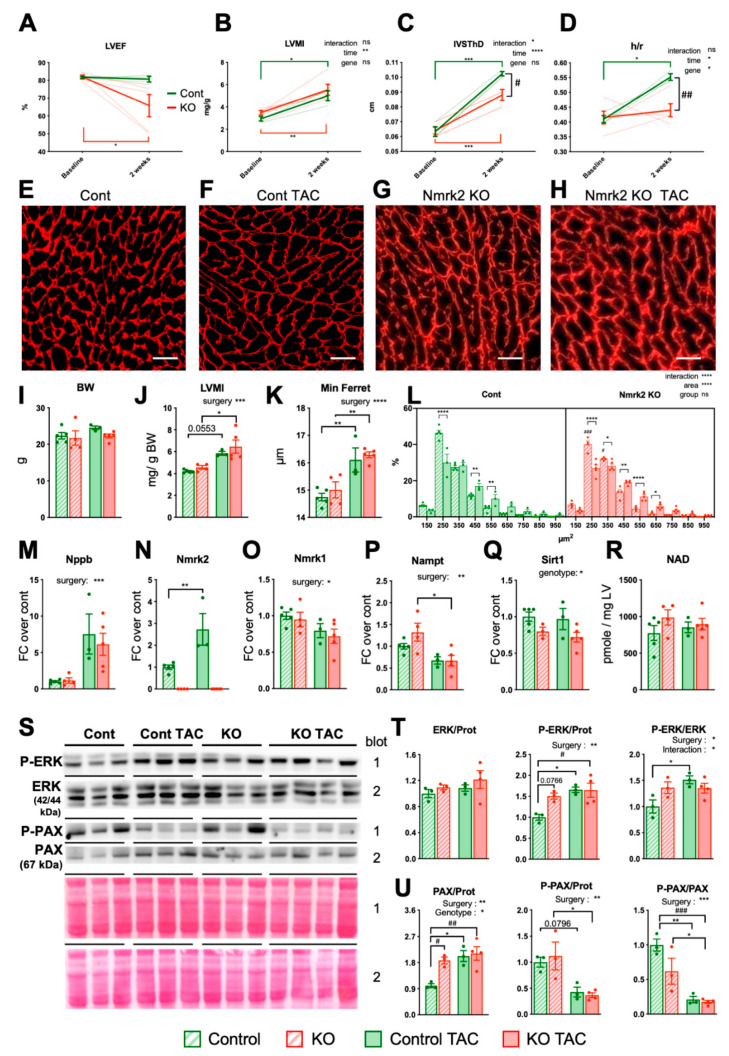
Figure 3.
Nmrk2-KO mice develop cardiac hypertrophy in response to transverse aortic constriction. Control mice (n = 3) and Nmrk2-KO mice (n = 5) were subjected to transverse aortic constriction (TAC) and sacrificed 15 days later for histological and molecular analyses. (A–D) Echocardiography before surgery (baseline) and after TAC (see accompanying Table 1). (A)Left ventricular (LV) ejection fraction. (B) LV mass index. (C) End-diastolic interventricular septum thickness. (D) LV wall thickness to radius ratio (end diastole). Data are shown a mean (full line) +/ SEM. Individual data are shown as dotted lines. (E–H) Cardiac sections stained with anti-laminin α2 antibody to demarcate cell boundaries, scale bars = 20 µM. (representative picture of n = 3 mice per group) (I–R) Post-sacrifice analyses of controls TAC (n = 3) and Nmrk2-KO TAC mice (n = 5) and age-matched 6 week-old controls (n = 4–5) and KO (n = 4–3) Body weight. (J) Left ventricular mass index at sacrifice. (K) Cardiomyocytes diameter (minimum Feret). (L) Cardiomyocytes area frequency plot. (M–Q) Relative expression by RT qPCR of indicated genes. Data normalized on Gapdh reference mRNA level. (R) Myocardial NAD levels. (S) Western blot analysis of ERK and Paxillin (PAX) total and phosphorylated form (P). (T,U) Quantification of western blots in panel S using Ponceau staining in the same region of the blot for normalization of loading. Throughout the figure, individual data are plotted as dots (n = 3 mice/group), bars and error bars represent mean value and SEM, respectively. In N to Q, T and U, data are expressed as fold changer over mean control value. Two-way repeated measure ANOVA for independent samples was used for A-D panels and two-way ANOVA for I-M and T-U panels: *, p ≤ 0.05; **, p ≤ 0.01; ***, p ≤ 0.001; ****, p ≤ 0.0001, as indicated next to graph title. Multiple comparison tests: Šidak for A–D panels, Tukey for I-R and T–U panels: *, p ≤ 0.05; **, p ≤ 0.01 ***, p ≤ 0.001 TAC vs baseline within the same genotype; #, p ≤ 0.05, ##; p ≤ 0.01; ###, p ≤ 0.001, Nmrk2-KO mice vs wild type as indicated or between control and Nmrk2-KO groups for panel L. t-test for N panel: **, p ≤ 0.01 between control and Nmrk2-KO groups.

