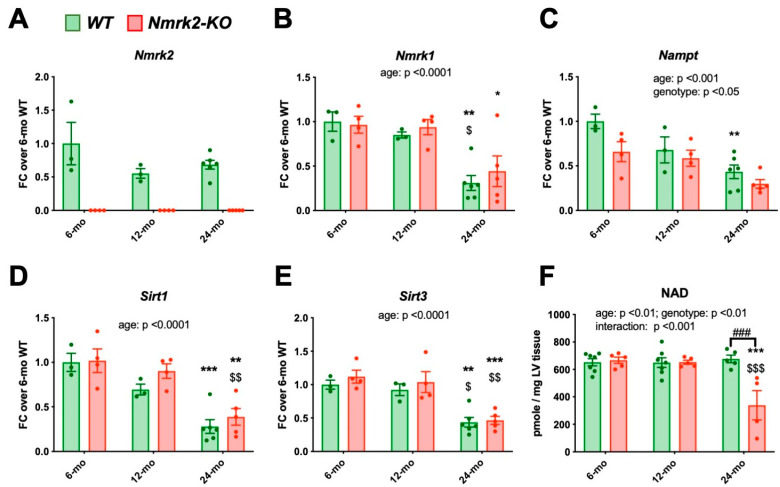
Figure 5.
Expression level of genes involved in NAD salvage pathway and quantification of NAD contents in the heart of control and Nmrk2 KO mice. (A–E) RT-qPCR analysis of cardiac mRNA from control (n = 3–6) and Nmrk2-KO mice (n = 4–5) at the age of 6, 12 and 24 months. Data are normalized on Gapdh reference mRNA level and expressed as fold change over the mean value of controls at 6 months. (F) Myocardial NAD levels. Individual data are shown by dots. Bars and error bars represent the mean value ± SEM. Statistics: Two-way ANOVA for independent samples: Factors p values are indicated are indicated next to the graph title. On bars, Post-hoc Tukey’s multiple comparison test: *, p ≤ 0.05; **, p ≤ 0.01; ***, p ≤ 0.001 24 months vs 6 months within the same genotype; $, p ≤ 0.05, $$; p ≤ 0.01; $$$; p ≤ 0.001, 24 months vs 12 months within the same genotype. ###, p ≤ 0.001, Nmrk2-KO mice vs wild type within the same age group.

