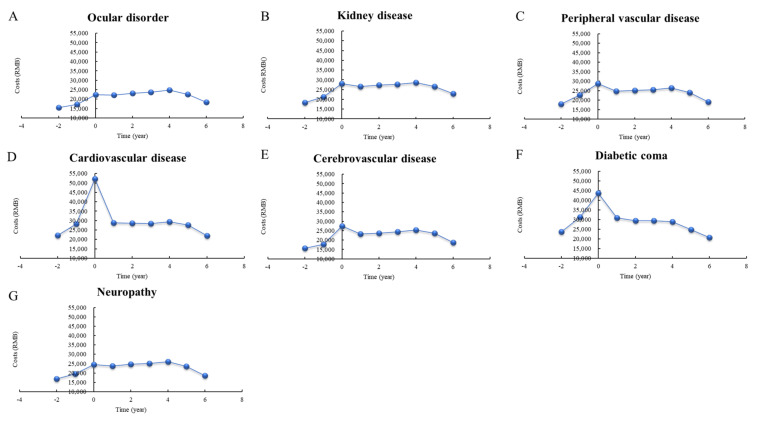
Figure 1.
Distribution of direct total medical costs per person before and after the incidence of complications, stratified by year. The x-axis shows the time period for the complication. “−2” means >2 years prior to the event; “−1” means <1 year before the event; “0” means <1 year after the event; “1” means 1−2 years after the event.

