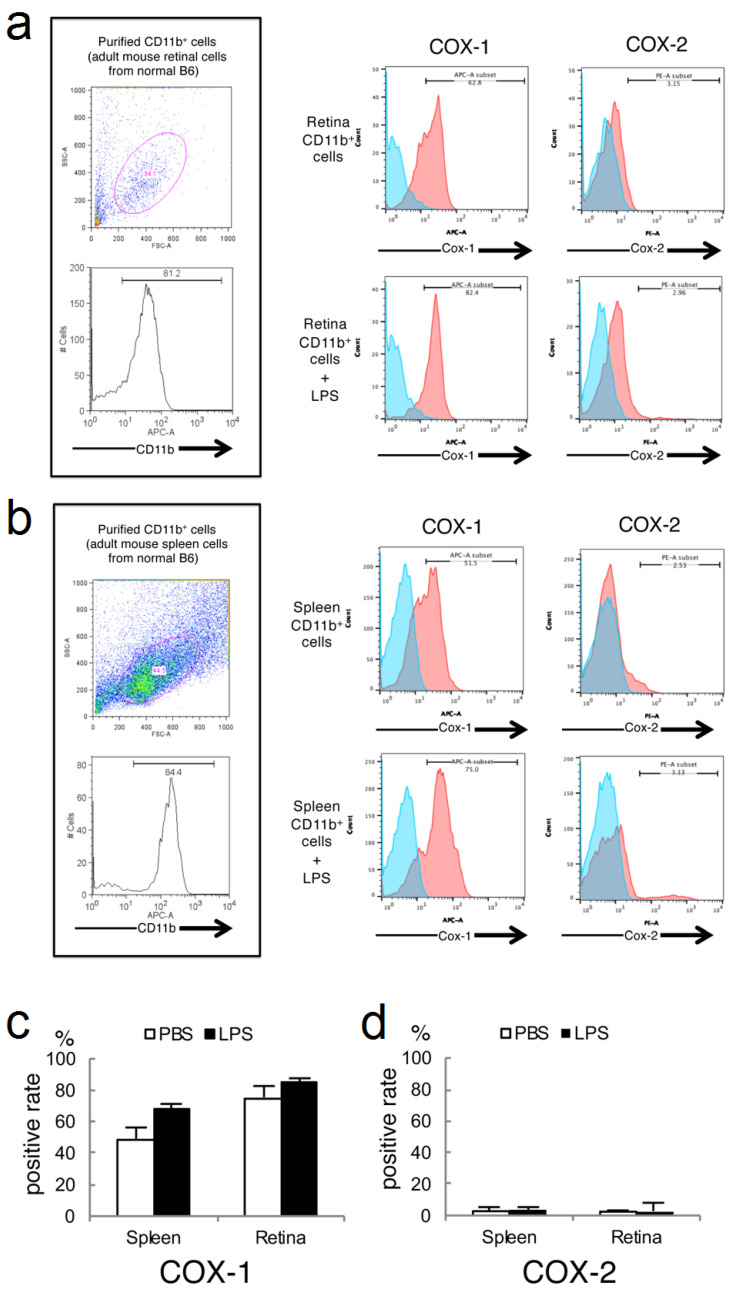
Figure 3.
In vitro analysis of the expression of COX-1 and COX-2 in retinal microglia/macrophage and splenic macrophage. (a) Cultured retinal glia cells of C57BL/6J mice were stained with anti-CD11b, anti-COX-1, and anti-COX2. A FACS cytometric analysis was performed 72 h after PBS- (upper) or LPS- (lower) administration. Red plots show the results of COX-1 or COX-2 positivity. Blue plots show the results of isotype control. Numbers (%) in the histogram indicate the ratio of positive cells. Thresholds were set by the staining with isotype control of the antibody. (b) Cultured splenic cells of C57BL/6J mice were stained with anti-CD11b, anti-COX-1, and anti-COX2. PBS- (upper) or LPS- (lower) administrated samples were analyzed on a FACS flow cytometer. Red plots show the results of COX-1 or COX-2 positivity. Blue plots show the results of isotype control. Numbers (%) in the histogram indicate the ratio of positive cells. Thresholds were set by the staining with isotype control of the antibody. (c) A graph showing the positive rate of COX-1 in splenic macrophages and retinal microglia/macrophage after administration of PBS (white bar) or LPS (black bar). An error bar showing standard deviation (SD). (n = 3). (d) A graph showing the positive rate of COX-2 in splenic macrophages and retinal microglia/macrophage after administration of PBS or LPS. Error bar shows SD. (n = 3).

