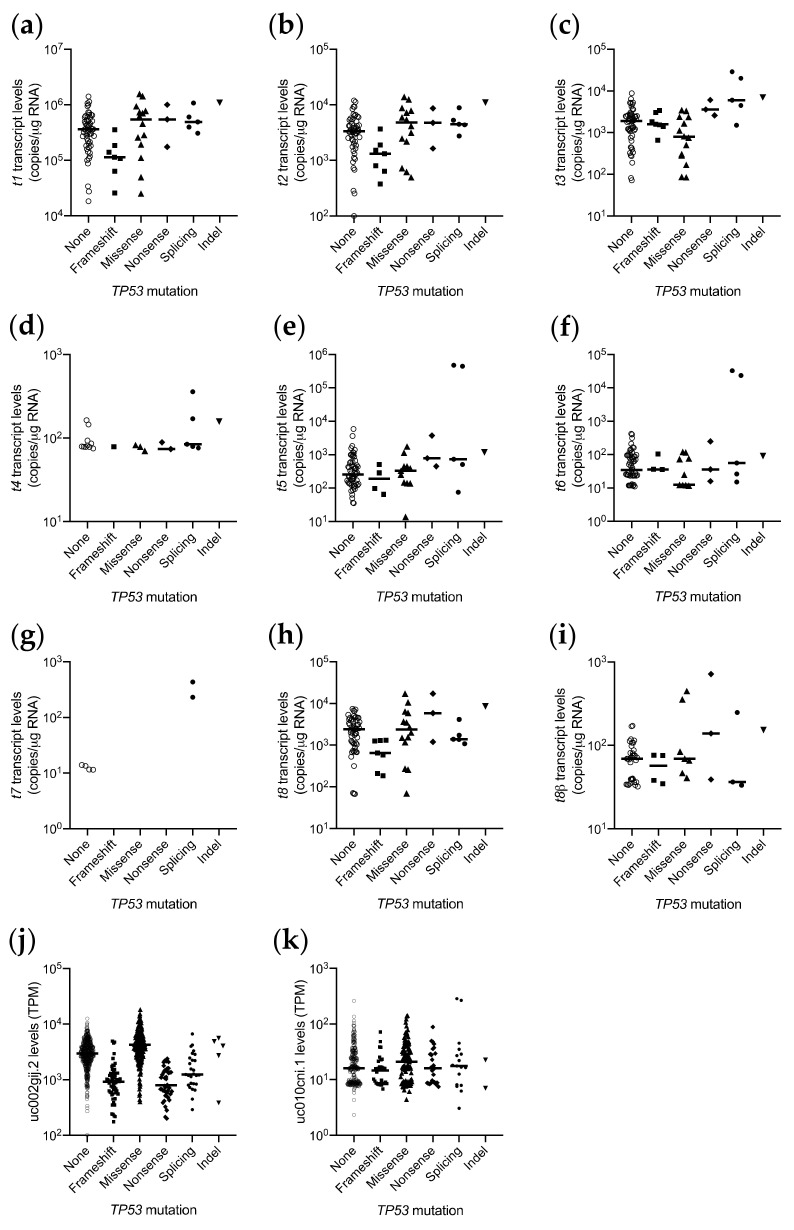
Figure 5.
Scatterplots showing TP53 transcript abundance by TP53 mutation status in breast cancer cohorts. (a–i) TP53 transcript levels in New Zealand breast cancer cohort, quantitated by long amplicon ddPCR. (a) LRG_321t1 encoding FL/∆40p53α, (b) LRG_321t2 encoding FL/∆40p53α, (c) LRG_321t3 encoding FL/∆40p53β, (d) LRG_321t4 encoding FL/∆40p53γ, (e) LRG_321t5 encoding ∆133p53α, (f) LRG_321t6 encoding ∆133p53β, (g) LRG_321t7 encoding ∆133p53γ, (h) LRG_321t8 encoding ∆40p53α, and (i) t8β encoding ∆40p53β, in each tumor. (j,k) TP53 transcript levels from the TCGA BRCA cohort, quantitated by RNA-seq, (j) uc002gij.2, encoding FL/∆40p53α, (k) uc010cni.1, encoding FL/∆40p53β. Bar represents the median, with symbols representing individual tumor samples.

