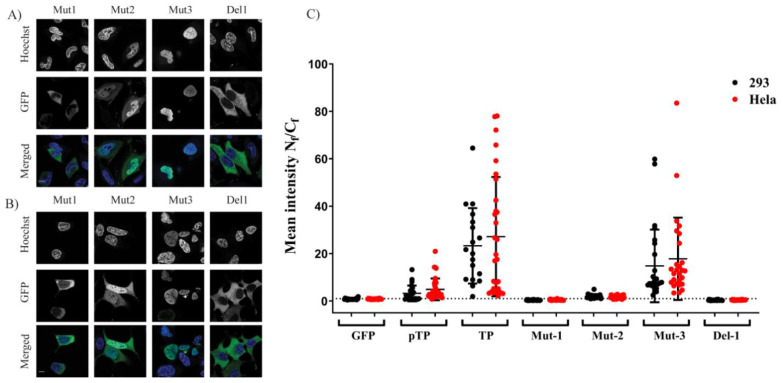
Figure 3.
Expression and localisation TP mutants. Specific locations in TP–GFP plasmid were either mutated or deleted as represented in Figure 1. HeLa (A) or 293A (B) cells were imaged and were presented as detailed in Figure 2 legend. Bar = 10 µM. (C) The mean fluorescence intensity ratio between the nucleus and cytoplasm of the mutants. Data were calculated and plotted similar to Figure 2B. Scale bar = 10 µM.

