Figure 6.

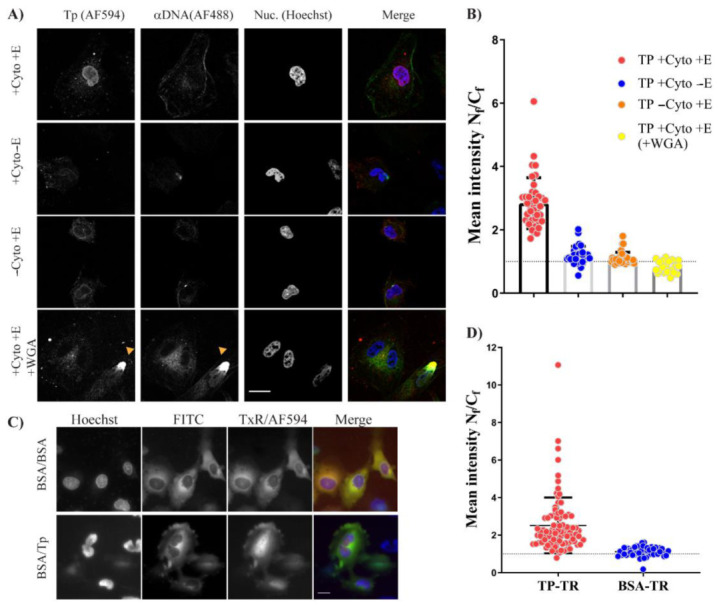
TP–Trx is translocated into the nucleus using active transport that requires energy. (A) TP–Trx labelled with AF594 was incubated with cells permeabilised with digitonin for 30 min as described in the Methods section. Images were taken with laser confocal microscopy using the same imaging criteria across all conditions. AF488 (αDNA) was used to determine whether the nuclear membrane is compromised. The orange triangle shows an example of the compromised nucleus next to two cells with an uncompromised nuclear membrane. Those compromised nuclei were excluded from the analysis and calculations. E: energy; Cyto: rabbit reticulocyte lysate cytoplasm; WGA: wheat germ agglutinin. (B) Analysis of the mean fluorescence (AF594) intensity ratio (Nf/Cf) from DPA experiments. Data collected from fluorescence images in (A) were analysed using Image J as described in the Methods section and mean fluorescence intensities were plotted. The dotted line represents Nf/Cf of 1. Difference between conditions was analysed using ANOVA test with Tukey’s multiple comparisons as described in Table S7. Bars represent mean ± SD. N > 23. (C) Cytoplasmic microinjection of labelled TP–Trx–AF594 with BSA–FITC to serve as a cytoplasmic control. As an additional control, BSA–TxR was used instead of TP–Trx–AF594 and coinjected, cytoplasmically, with BSA–FITC. Images were taken approximately 30 min after microinjection of the proteins. (D) Nf/Cf ratios between TP–Trx injected compared to BSA control. Analysis of difference between the two conditions was conducted using Welch’s t–test with p–value < 0.0001. N > 50, mean ± SD. Scale bar = 10 µM.
