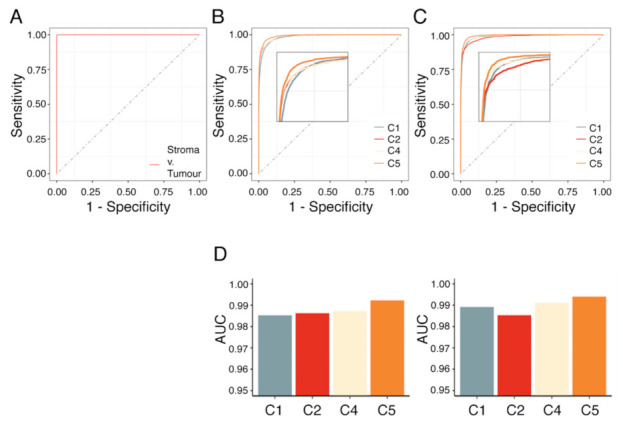
Figure 6.

AUC analysis of RF model on stroma-labeled datasets, subtype-labeled datasets with and without spectra associated with the stroma compartment. Area under the curve (AUC) analysis of (A) stroma classification, (B) subtype classification, and (C) consecutive stroma and subtype classification such that spectra corresponding to stroma were excluded. (D) Average AUC for each subtype following a one-vs.-one strategy for the dataset with (left) and without stroma (right).
