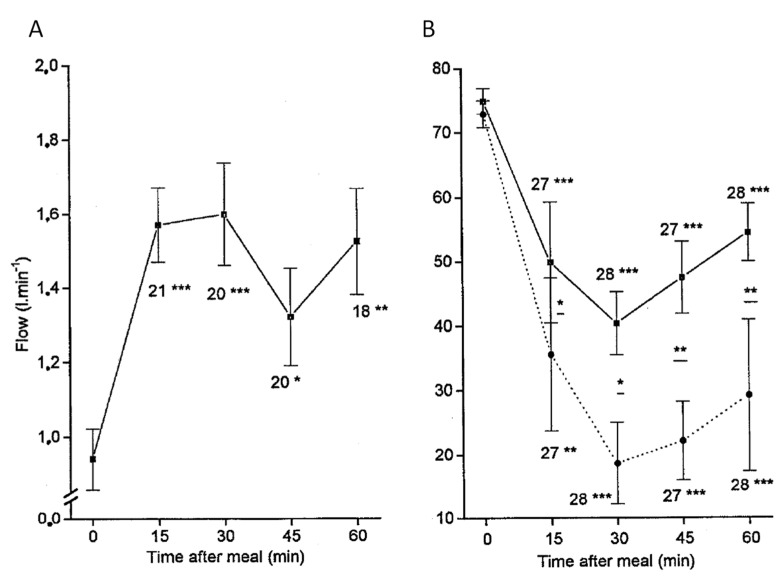
Figure 2.
(A) Portal flow and (B) arterial to portal blood velocity ratio, both monitored by Doppler ultrasonography after ingestion of a standard liquid meal of 500 kcal. In (B), full and dashed curves correspond to left and right hepatic arteries, respectively. The number of observations and p for the student t-test for each measurement against the baseline appear under the error bars: * p < 0.05; ** p < 0.005; *** p < 0.0005. (reprinted from [18] with authorization of Springer Nature).

