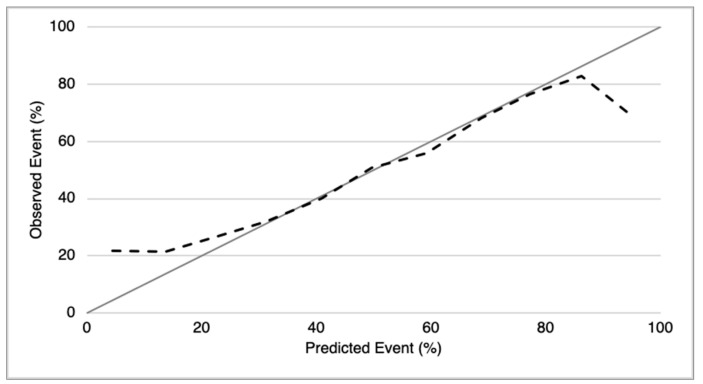
Figure 3.
Smooth Calibration plot for the validation of CFZ CVAEs Risk Score. Comparison between observed and predicted CVAEs based on bootstrap. The grey line represents the perfect condition in which the observed CVAEs are equal to predicted CVAEs; the black line represents the CVAEs observed in our population.

