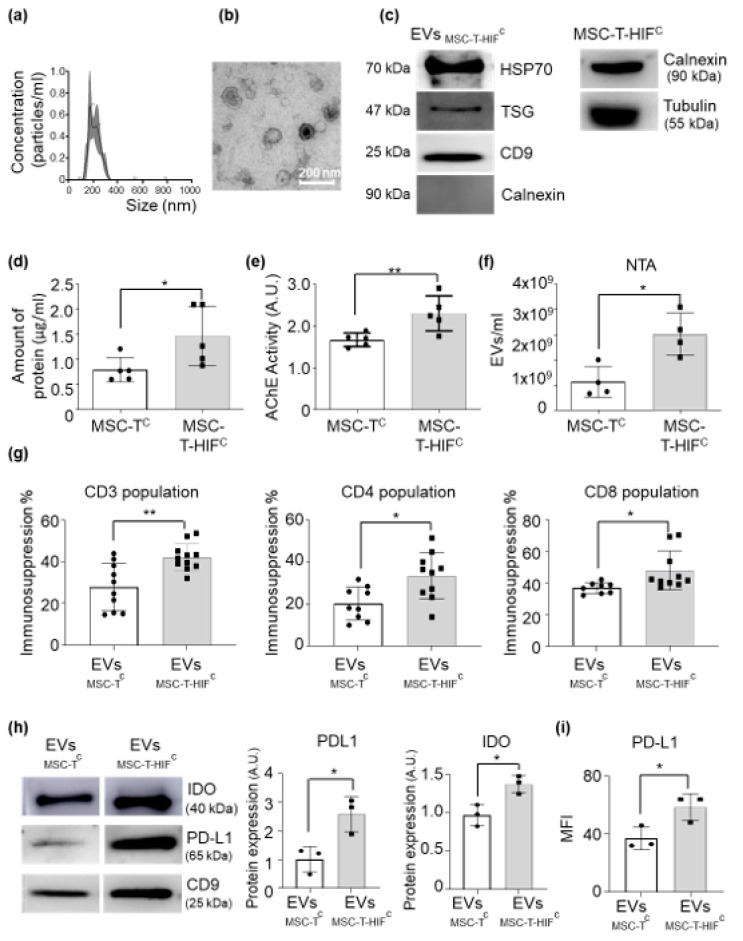
Figure 4.
MSC-T-HIFc-derived EVs (EVMSC-T-HIFc) display enhanced immunosuppression properties. (a) Representative images of EVs collected from MSC-T-HIFc evaluated by nanoparticle tracking analysis (NTA). (b) Representative electron microscopy images of isolated EVs collected from MSC-T-HIFc. Scale bar: 200 nm. (c) Representative Western blots of Hsp70, TSG101 and CD9 proteins in EVs. Absence of calnexin demonstrates a pure EV preparation. Cells were used as calnexin-positive controls (d) Concentration of protein of EVs extracted from 100 mL of culture medium from 1 × 10⁷ cells that were resuspended in 100 μL of PBS. Graphs represent mean ± SD of six independent experiments. Paired t-test was used for statistics. (e) Quantification of acetylcholinesterase activity in EVMSC-Tc and EVMSC-T-HIFc. Values are represented as relative to the EVMSC-Tc value. Graph represents mean ± SD of three independent experiments. Paired t-test was used for statistics. (f) Amount of EVs per milliliter in the supernatant of the same number of MSC-Tc and MSC-T-HIFc measured by NTA. Graphs represent mean ± SD of three independent experiments. Unpaired t-test was used for statistics. (g) Peripheral blood mononuclear cells (PBMCs) were stained with CFSE and stimulated with anti-CD3 and anti-CD28 beads in the presence or absence of EVMSC-Tc or EVMSC-T-HIFc. After 6 days, cells were stained with anti-CD3, anti-CD4 and anti-CD8 antibodies and the proliferation of T-cell subsets was determined by flow cytometry of CFSE dilution. Suppression (percentage) was calculated based on the expansion index. Graph represents mean ± SD of seven independent experiments. Unpaired t-test was used for statistics. (h) Representative Western blots of IDO and PD-L1 proteins in EVMSC-Tc and EVMSC-T-HIFc. Expression levels were quantified by densitometry relative to EVMSC-Tc. CD9 was used as a loading control. Graph represents mean ± SD of three independent experiments. Paired t-test was used for statistics. (i) PD-L1 protein expression level measured by flow cytometry using the mean fluorescence intensity of EVMSC-Tc and EVMSC-T-HIFc. Values are represented as relative to the EVMSC-Tc geometric mean value. Graphs represent mean ± SD of three independent experiments. Paired t-test was used for statistics. * p < 0.05, ** p < 0.01.

