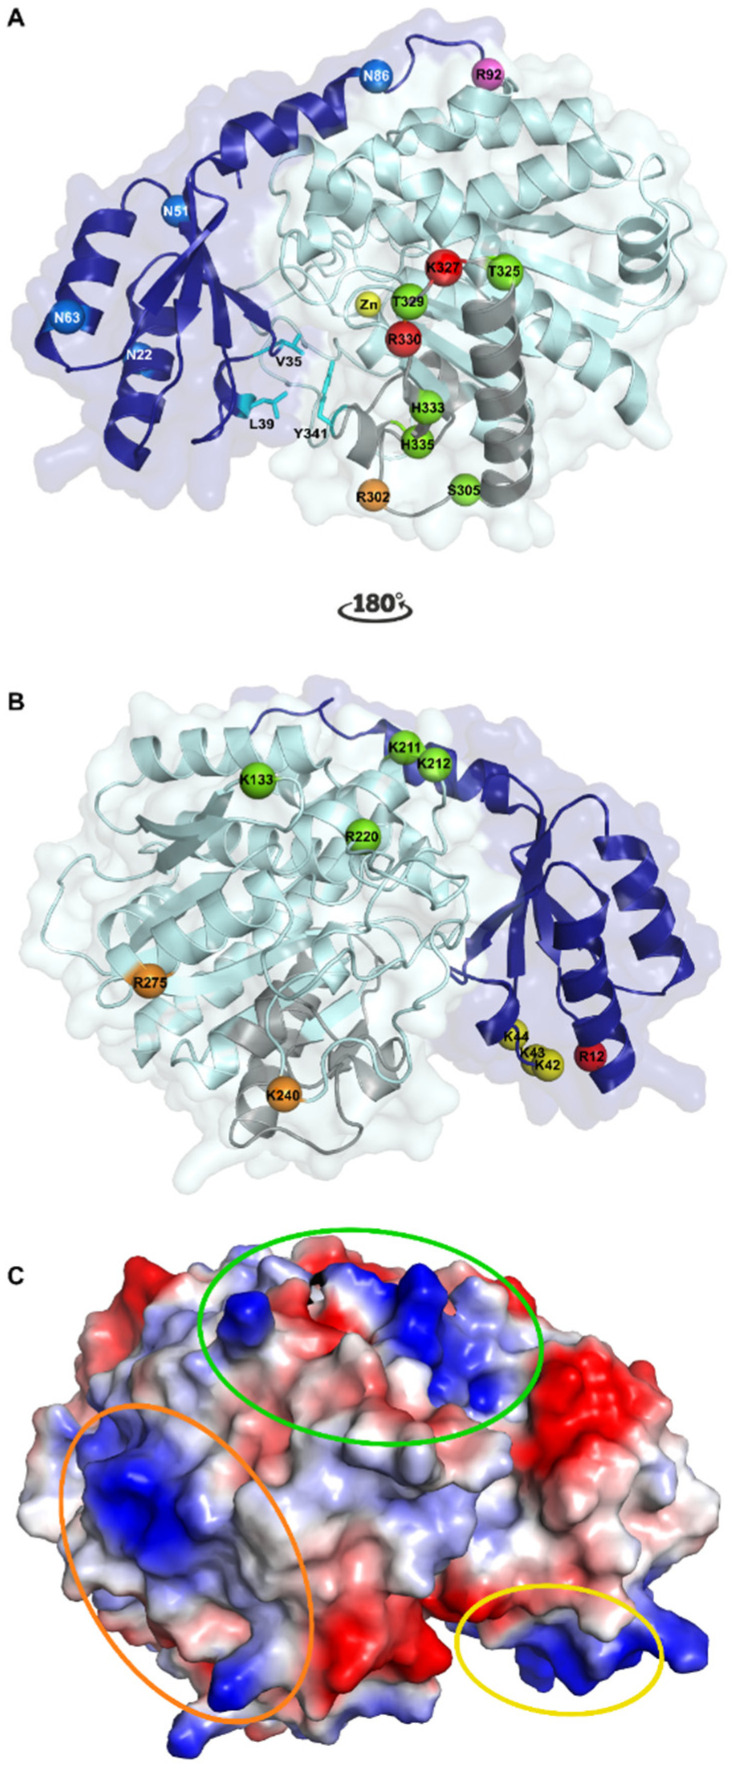
Figure 1.
Crystallographic structure of human thrombin activatable fibrinolysis inhibitor (TAFI). (A) Cartoon representation of TAFI. The activation peptide (AP) and the catalytic moiety are colored in dark and light blue, respectively. The catalytic zinc-ion in the active center is shown as a yellow sphere. The four glycosylation sites in the AP (Asn22, Asn51, Asn63, and Asn86) are represented by blue spheres. TAFI can be activated through cleavage at Arg92 (shown as a magenta sphere) by thrombin, plasmin, or the thrombin/thrombomodulin complex. Upon the subsequent conformational change to inactivated TAFIa, (TAFIai) a cryptic cleavage site at Arg302 (shown as an orange sphere) becomes exposed and can be cleaved by plasmin or thrombin. Two additional plasmin cleavage sites, Lys327 and Arg330, are indicated by red spheres. Five residues that have been mutated within the dynamic flap region (colored in grey) and result in the most stable TAFIa mutant are indicated by green spheres (Ser305Cys, Thr325Ile, Thr329Ile, His333Tyr, and His335Gln). The dynamic flap, of which the mobility leads to conformational changes that disrupt the catalytic site to form TAFIai, is stabilized by hydrophobic interactions between Val35 and Leu39 of the AP and Tyr341 in the dynamic flap (shown as cyan sticks). (B) Binding sites on TAFI for TAFI-activators after rotating panel A by 180° along the y-axis. The three putative thrombomodulin (TM) binding sites, Lys42/Lys43/Lys44, Lys133/Lys211/Lys212/Arg220, and Lys240/Arg275, are indicated by yellow, green, and orange spheres, respectively. Arginine at position 12, which plays an important role in TM-stimulated TAFI activation by thrombin, is indicated by a red sphere and may either constitute a potential cleavage site for thrombin or an exosite for TM. Furthermore, Lys133 may also be a part of the plasmin binding site on TAFI. (C) Charged surface representation of TAFI. The three putative TM binding sites are indicated by ovals in the same color as the spheres representing the binding sites in panel B. This figure was generated using the Protein Data Bank structure with PDB ID 3D66 [30]).

