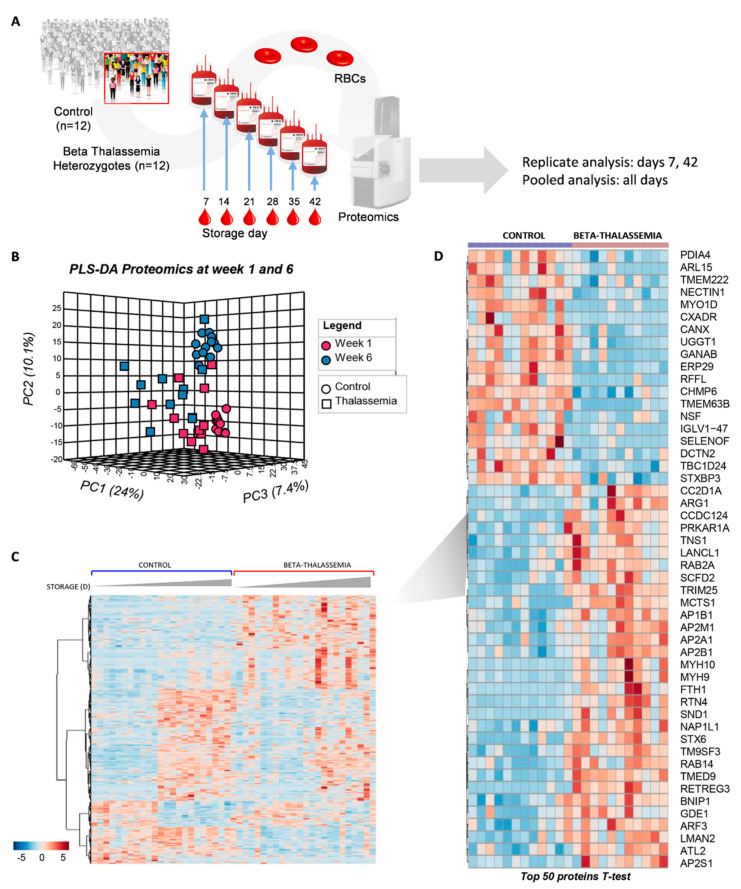
Figure 1.
Proteomics analysis of the stored RBC membrane. (A) Isolated membranes from n = 12 βThal+ and n = 12 control RBC units were analyzed by proteomics tools in single replicates (day 7 and day 42 samples) or in pooled samples (days 7–42 at weekly intervals). (B) Principal component and discriminant analysis of day 7 and day 42 samples. (C) Heat map showing differentially expressed proteins between the two groups at early and late storage. (D) Heat map showing the top 50 proteins differing between βThal+ and control membranes at early storage.

