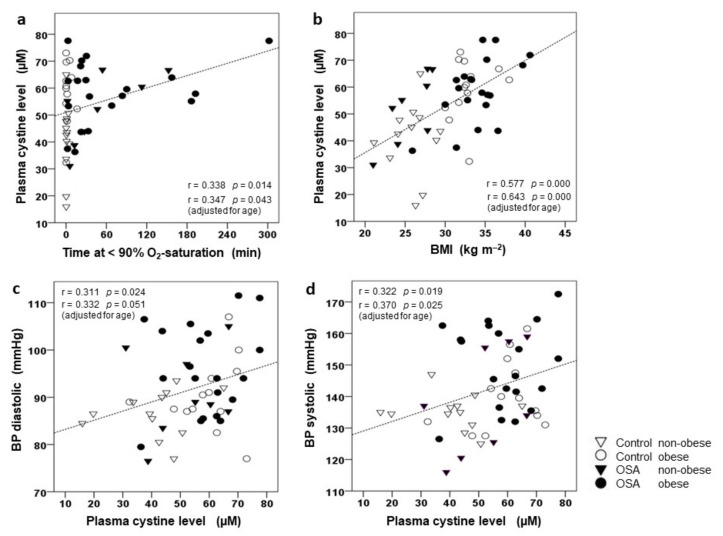
Figure 3.
Correlation of plasma cystine (CySS) concentration to cumulative time spent at O2-saturation < 90% (Tu90%) (a) and to BMI (b) as well as correlation between diastolic (c) and systolic (d) brachial blood pressure (BP) and plasma CySS concentration. Graphs present scatterplots of individual values with indications of groups (OSA, control) and their strata (non-obese, obese), the regression lines as well as regression coefficients r and p-values. In addition, r and p-values are given for (multivariate) correlation adjusting for age.

