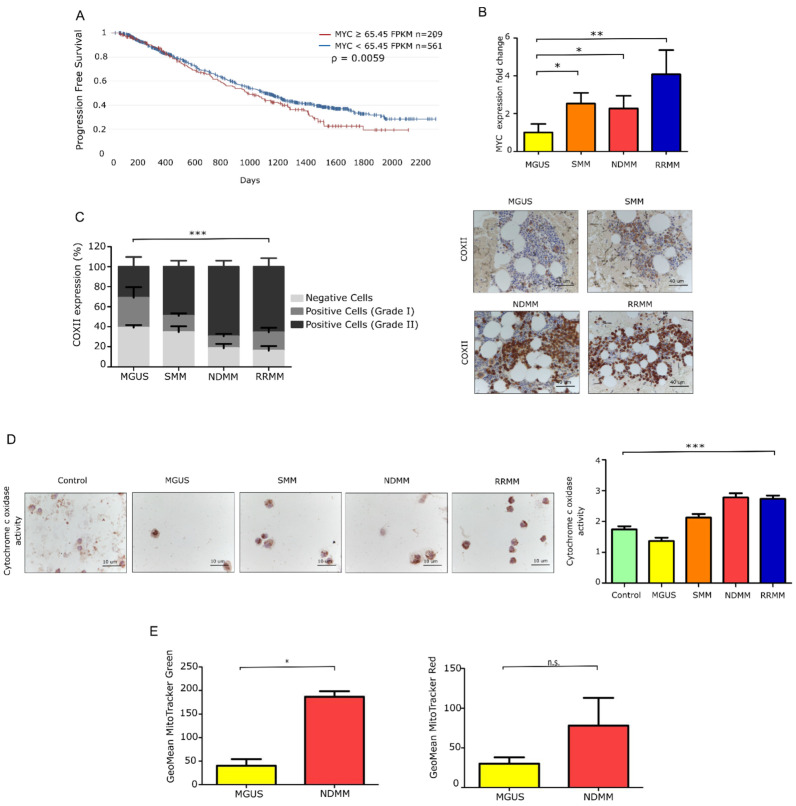
Figure 1.
Mitochondrial features in primary MM cells from distinct myeloma entities. (A) Progression-free survival (PFS) of MM patients from the CoMMpass study (IA14) stratified according to MYC gene expression. (B) Fold-change in gene expression of MYC relative to GUS B expression (MGUS N = 9; SMM N = 9; NDMM N = 18; RRMM N = 11). Data are presented as mean values ± SEM of technical triplicates. (C) Intracellular expression of COXII in samples from MM patients (N = 4 MGUS, N = 7 SMM, N = 13 NDMM, and N = 11 RRMM). Microscopy analysis of the immunohistochemistry (IHC) slides from bone marrow samples (p value = 0.0001). Representative images addressing differences in COXII expression between patients at different stages of the disease. Scale bar, 40 μm. Data are presented as mean values ± SEM. Statistical significance was assessed using two-way ANOVA. (D) Histoenzymatic reaction to cytochrome c oxidase enzyme (HE-COX) in donors and patients across the different stages of the disease (N = 2 donor, N = 4 MGUS, N = 5 SMM, N = 5 NDMM and N = 4 RRMM). Relative HE-COX scores in fresh plasma cells (CD138+) ranging from Grade 0: no stain; Grade 1: low stain; Grade 2: medium stain; Grade 3: high stain; Grade 4: very high stain. Representative images show different intensity stains related to enzyme activity. Data are presented as mean values ± SEM. (E) Mitochondrial mass and membrane potential in MM patients (N = 3 MGUS, N = 3 NDMM), assessed by flow cytometry. Data represent the geometric mean ± SEM of three independent experiments. * p < 0.05, ** p < 0.001, *** p < 0.0001, n.s. no significance.

