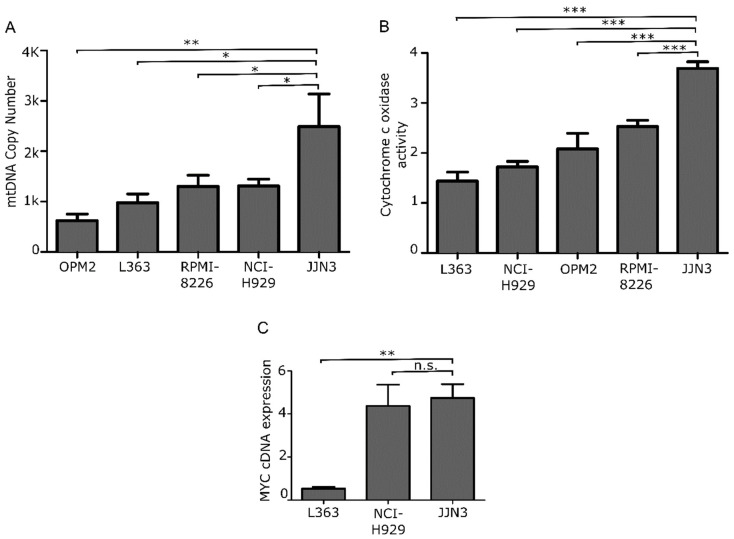
Figure 2.
Mitochondrial features in MM cell lines. (A) mtDNA CN analysis and (B) HE-cox assay quantification in 5 MM cell lines. (C) Fold-change gene expression level of MYC in L363, NCI, and JJN3 cell lines relative to GUS B expression. Data are presented as mean values ± SEM of technical triplicates. * p < 0.05, ** p < 0.001, *** p < 0.0001, n.s. no significance.

