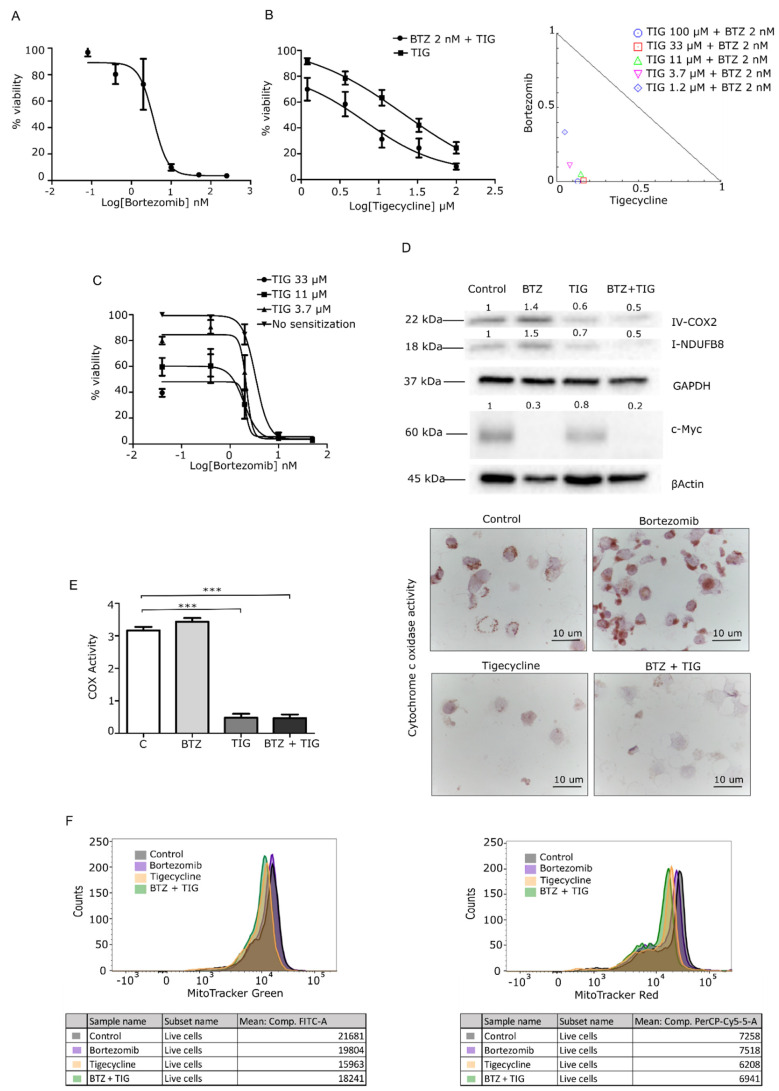
Figure 3.
Tigecycline and the combination with bortezomib inhibits cancer cell growth and mitochondrial activity in the JJN3 cell line. (A) Cells were treated with a dose range of 0–250 nM of BTZ, and viability was determined using the calcein cytotoxic assay. (B) Cells were treated with a dose range of 0–100 μM of TIG with/without 2 nM BTZ, and viability was determined using the calcein cytotoxicity assay. TIG showed an IC50 of 21.3 µM in JJN3 cells, and the combination decreased threefold the IC50 value (6.6 µM). Isobologram plot of the combination; dots indicate the combinatory index (CI) of each combinatory dose. (C) IC50 curve after treating cells for 48 h with TIG for consecutive 48 h with bortezomib. Data are normalized to the negative control (DMSO) and presented as mean values ± SEM of technical triplicates. (D–F) molecular validation of mitochondrial inhibition of JJN3 cells treated with 3.7 µM TIG, 2 nM BTZ, or both (combination). All of the drug treatments were for 48 h; N = 1 independent biological repeat. (D) WB of respiratory chain complexes I and IV and c-Myc. (E) HE-COX analysis in >10 cells per sample. (F) Multiparametric flow cytometry (MFC) analysis of MitoTracker green (left, mitochondrial mass) and Red (right, mitochondrial membrane potential). Representative histograms show cell counts for each probe on the different treatment conditions. *** p < 0.0001.

