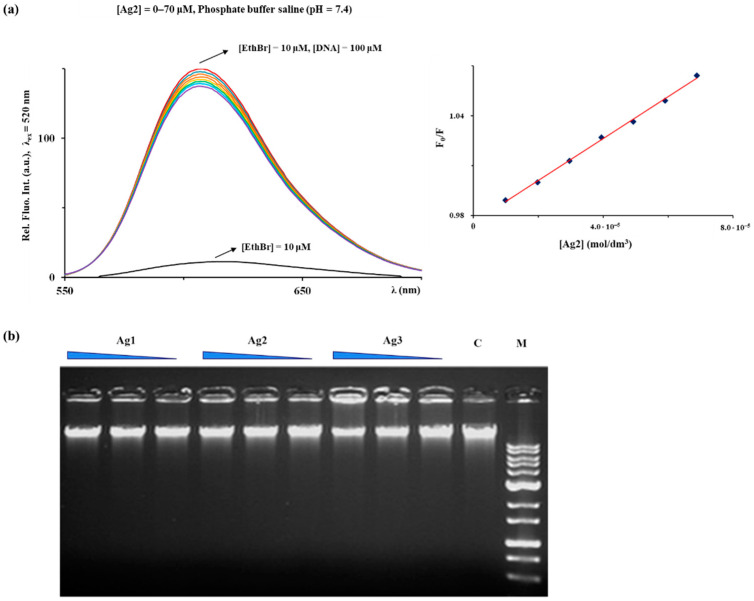
Figure 7.
(a) Fluorescence emission spectra of EthBr–DNA system in the presence of an increasing amount of Ag2 complex. The arrow shows the intensity changes upon the gradual addition of the complex. Inserted graph: Stern-Volmer plots of F0/F vs. complex. (b) Interaction of silver(I) complexes Ag1–3 with commercial lambda bacteriophage DNA assessed by gel electrophoresis. 0.8% agarose gel with EthBr against a HyperLadder™ 1 kb DNA Ladder plus (FastGene) (Mw), DMSO is a control sample (C). Gel visualization by the Gel Doc EZ system (Bio-Rad, Life Sciences, Hercules, USA), equipped with the Image Lab™ Software.

