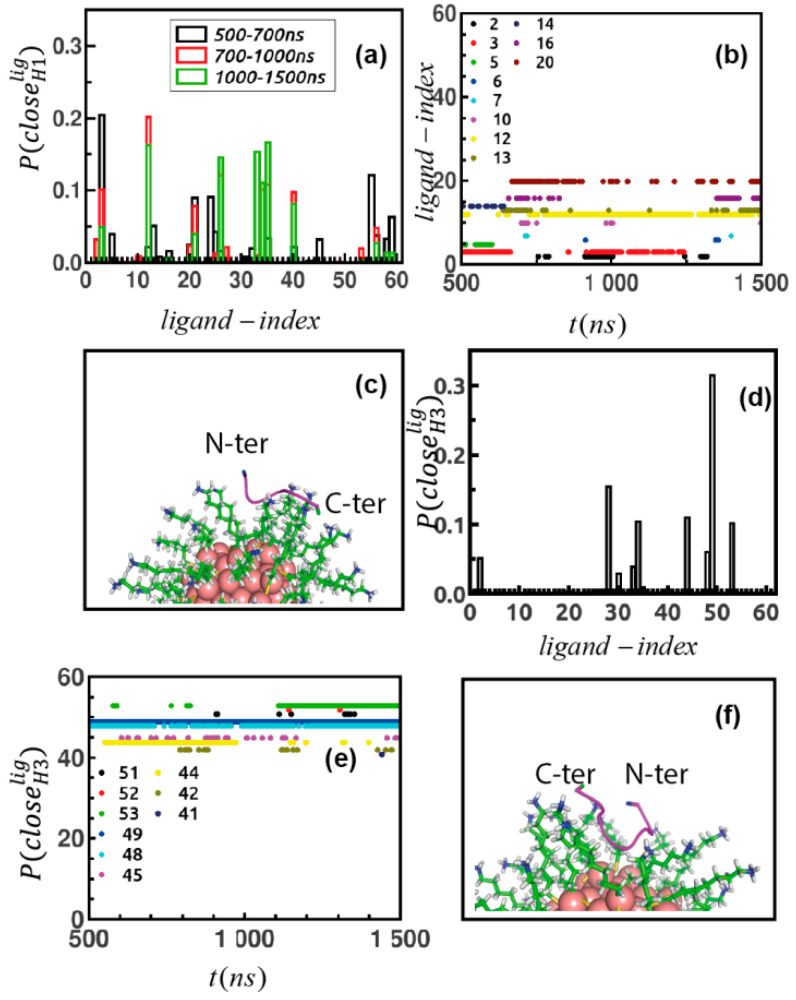
Figure 6.
(a) Statistical plot of ligands showing strong contribution in binding with peptide H1. (b) Ligands that make contact with peptide H1 simultaneously over simulation time. (c) Final binding orientation of H1 bound Au144(L)60; ligand in cyan, stick mode, peptide in magenta, binding residue terminal ASP are in red and N Histidine is in blue, CPK representation. (d) Contributing ligands in binding with H3. (e) Ligands making simultaneous contact with H3 over simulation time and (f) final structure of H3 with Au144(L)60, color code is same as Figure 6c.

