Figure 2.
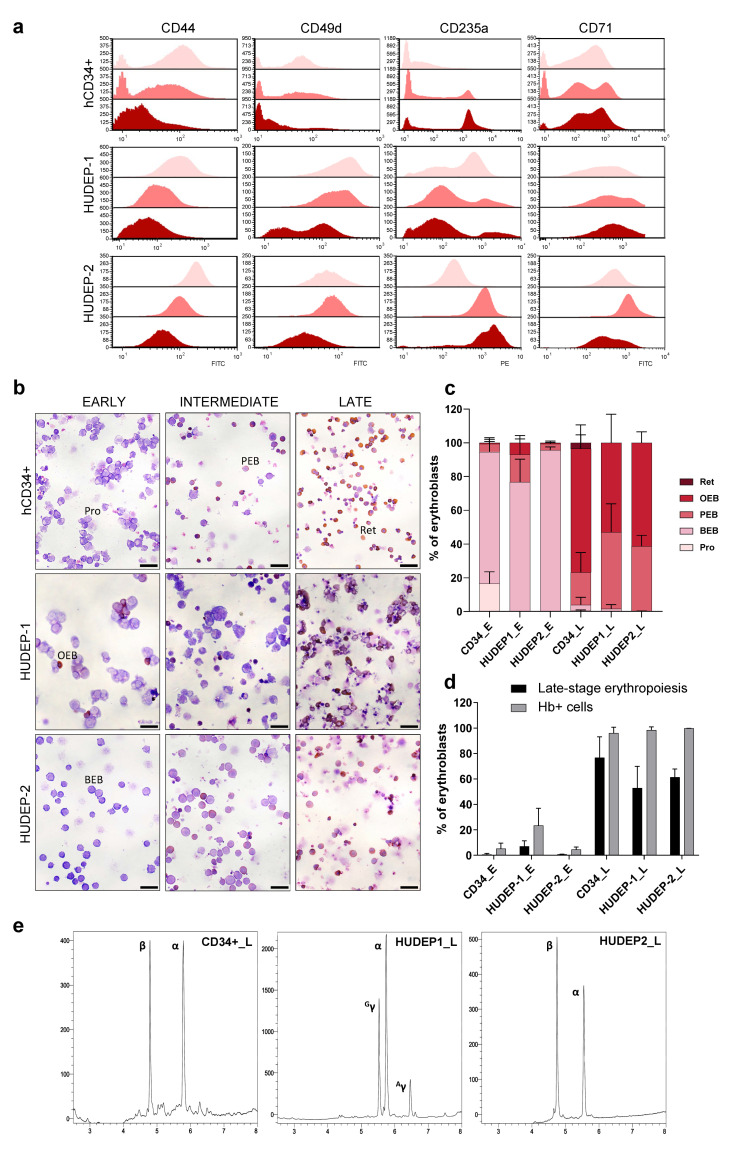
Assessment of erythroid differentiation in cell culture systems. (a) Flow cytometric analysis of indicated surface markers (CD44, CD49d, CD235a, and CD71) during erythroid differentiation. Colors in stacked overlaid histograms represent the three stages of erythroid differentiation: _E (pink), _I (light red), and _L (dark red). The ordinate represents the number of cells displaying the fluorescent intensity given by the abscissa. (b) Representative images of o-Dianisidine and May–Grünwald/Giemsa staining of cytocentrifugation samples prepared at _E, _I, and _L stages of erythroid differentiation in hCD34+, HUDEP-1, and HUDEP-2 cells. Scale bars: 25 μm. (c) Average percentages of erythroid subpopulations across all samples according to differential counting of cells. (d) Average percentages of cells in late-stage erythropoiesis (orthochromatophilic and reticulocytes) (black bars) and average percentages of hemoglobin-producing cells (o-Dianisidine positive) (grey bars). (e) Reversed-phase high-performance liquid chromatography chromatograms of globin expression in _L cultures. Pro: proerythroblast, BEB: basophilic erythroblast, PEB: polychromatophilic erythroblast, OEB: orthochromatophilic erythroblast, Ret: reticulocyte.

