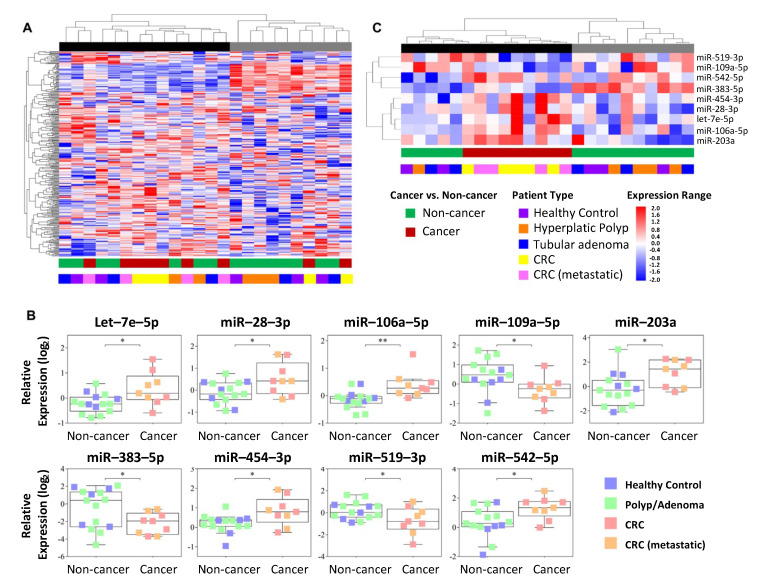
Figure 2.
Hierarchical clustering analysis and plots representing plasma miRNAs. (A) Unsupervised hierarchical clustering analysis of 292 circulating miRNAs (RT-qPCR-TaqMan Low-Density Array (TLDA) assay). (B) Differential expression of nine miRNAs in the plasma of cancer versus non-cancer cases. The boxplot displays the first quartile, median, and third quartiles (interquartile range) and the minimum and maximum values excluding outliers of the log2-normalized relative quantification of the miRNAs in plasma (RT-qPCR-TLDA assay). (C) Supervised hierarchical clustering analysis comprising the nine differentially expressed miRNAs. The dendrogram demonstrates a stratification of samples into two clusters (black and gray) associated with the cancer status. The lines in the heatmaps represent individual miRNAs, and the columns represent each sample; * p < 0.05; ** p < 0.01 (t-test).

