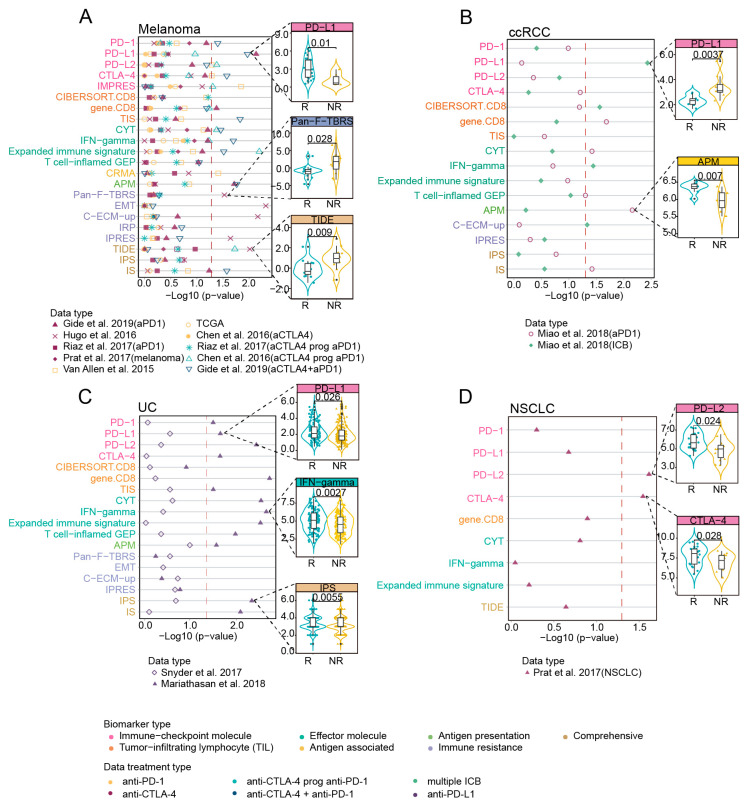
Figure 3.
Correlation of biomarkers with clinical response to ICB across multiple datasets with different cancer types. (A–D) Left: the two-sided Wilcoxon rank-sum test p value indicating whether biomarkers significantly differentiate between responders versus non-responders (NR) (patients stratification using “PD” strategy) in distinct tumors, red dashed line indicated 0.05 threshold of p value. The color of the dot represented ICB treatment types of each dataset. Magenta denoted anti-PD-1, yellow denoted anti-CTLA-4, light green denoted “anti-PD-1 after progression on prior anti-CTLA-4”, blue represented combined anti-PD-1 and anti-CTLA-4 immunotherapy, grass green represented multiple ICB treatments, and purple represented anti-PD-L1. Right: boxplots showing examples of biomarkers with significant difference (Wilcoxon rank-sum test p < 0.05) between the responding (R) versus non-responding (NR) tumors. Black lines in the box represented upper 75%, median, and lower 25% values.

