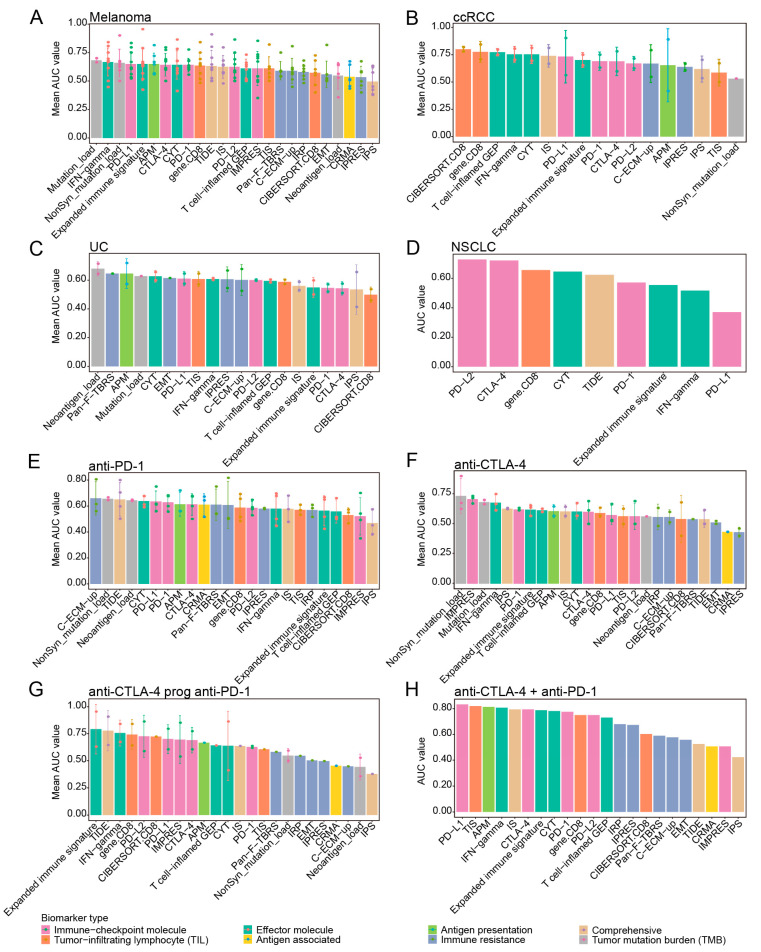
Figure 5.
Prediction performance of biomarkers for ICB response across different cancer types and different ICB therapy strategies. (A–D) Bar centre was defined by the mean AUC values of each transcriptomic biomarker across different cancer datasets (patients stratification using “PD” strategy), and error bars indicated ±1 SD. (E–H) Bar centre was defined by the mean AUC values of each transcriptomic biomarker in melanoma datasets under different ICB therapy strategies (patients stratification using “PD” strategy), and error bars indicated ±1 SD.

