Figure 4.
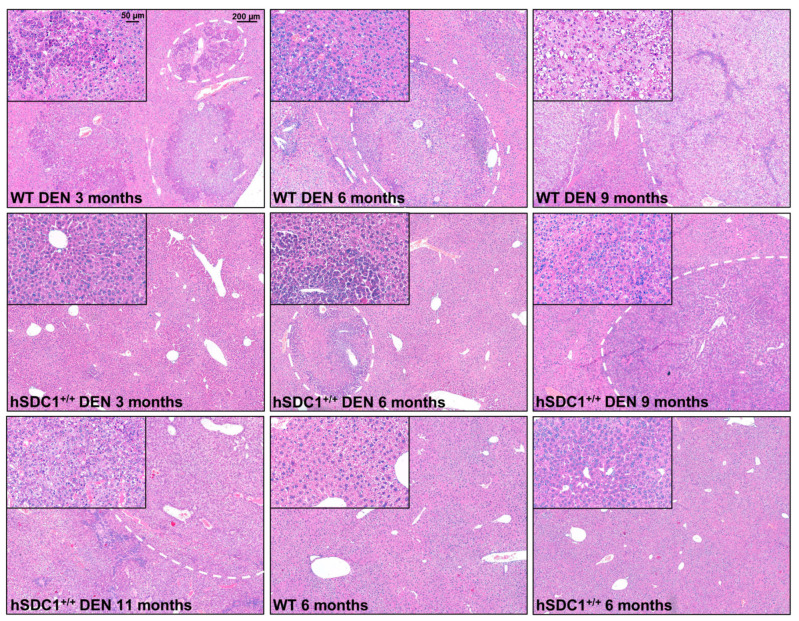
Liver histology of WT and hSDC1+/+ mice. The first row demonstrates cancer progression in WT DEN-treated livers. Preneoplastic foci already appeared at month 3, and their number increased by month 6 along with the emergence of overtly cancerous nodules. At month 9, WT livers were almost completely obliterated by cancer. The second row shows hSDC1+/+ livers at the same time points. No foci were seen at month 3. The first foci appeared at month 6; these grew further by month 9, and a few small neoplastic nodules developed. The left panel in the third row shows a representative DEN-treated hSDC1+/+ liver at month 11 with a high number of cancer nodules. Both WT and hSDC1+/+ were similar in histology with round-shaped polymorphic nuclei, clear cytoplasm, and frequent cell divisions. Untreated WT and hSDC1+/+ livers were essentially indistinguishable by histology. No sign of liver fibrosis or cirrhosis was detected. Representative images are at 50× (main pictures) and 200× (insets) magnification with scale bars of 200 μm and 50 μm, respectively. Representative scale bars are inserted into the first pictures.

