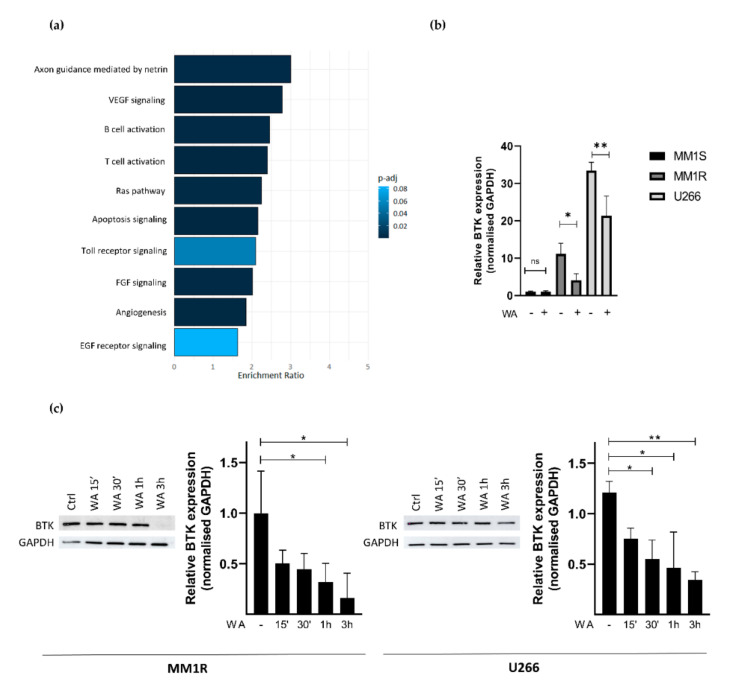
Figure 3.
(a) Panther pathway enrichment analysis of significant (FDR < 0.05) differentially expressed genes of WA-treated MM1R cells as determined by RNA sequencing. (b) Relative BTK mRNA levels of MM1R, MM1S and U266 cells treated with WA for 3 h. Data are plotted as the mean ± s.d., n = 3 biologically independent replicates (* p = 0.0453, ** p = 0.0015, ANOVA) (c) Western blot detection and quantification of BTK and GAPDH expression levels after WA treatment in MM1R and U266 cells. Data are plotted as the mean ± s.d., n = 3 biologically independent replicates. (* p < 0.05, ** p < 0.01, ANOVA).

