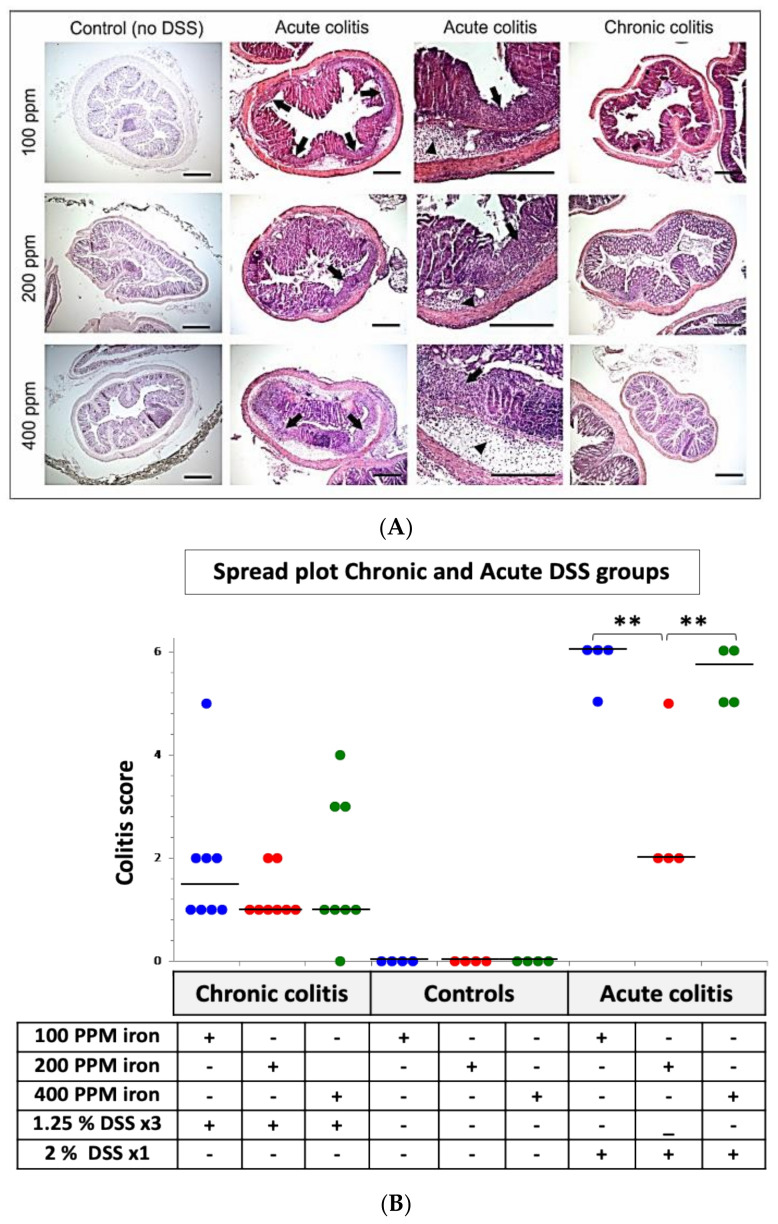
Figure 2.
Histological analysis of colon from DSS-treated mice in consuming diets of differing dietary iron levels. (A) Representative hematoxylin and eosin-stained segments of distal colon from control C57BL/6J mice ingesting 100, 200 or 400 ppm iron diets alone (n = 4 mice in total), C57BL/6 with acute (n = 4) and chronic DSS-induced colitis (n = 8) administered with 100, 200 or 400 ppm iron diets as indicated. Arrowheads highlight submucosal oedema; arrows highlight almost complete loss of colonic epithelium and leukocyte infiltration. Scale bar: 200 µm. (B): Inflammation (colitis) scores for all groups’ DSS-treated (24 (63-days) and 12 (10-days) mice per group) and untreated (controls) 12 (63-days) mice on different iron diets. Horizontal lines at the median. an iron deficient diet (100 ppm iron [blue]), standard chow diet (200 ppm iron [red]) nor an iron supplemented diet (400 ppm iron [green]) Differences tested by Kruskal–Wallis test followed by multiple comparison tests ** p < 0.01.

