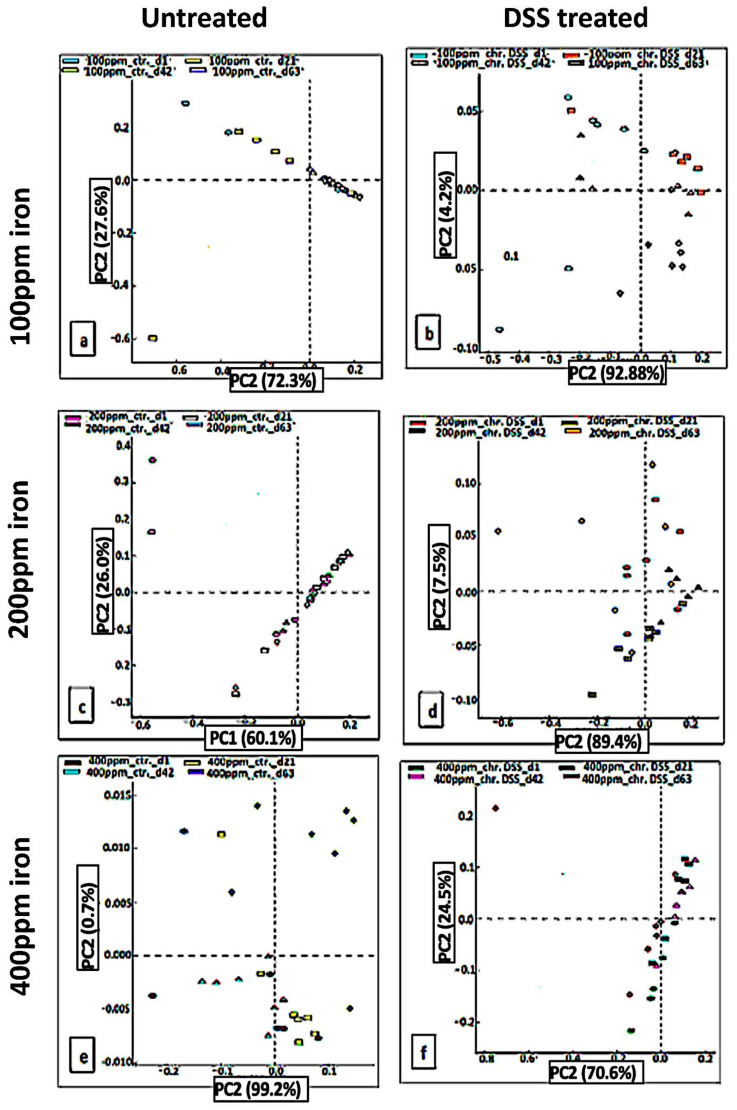
Figure 4.
PCA to show unweighted UniFrac diseases after DSS treatment. In chronic DSS, PCA plots of the unweighted UniFrac distances of pre-and post-DSS-intervention stool samples from chronic (3 cycles) DSS – treated mice (b,d,f) and (a,c,e) untreated mice at phylum-level, phylogenetic classification of 16S rRNA gene sequences. Symbols represent data from individual mice, color-coded by the indicated metadata. Statistical differences were assessed by Kruskal–Wallis H-test followed by Storey’s FDR multiple test correction.

