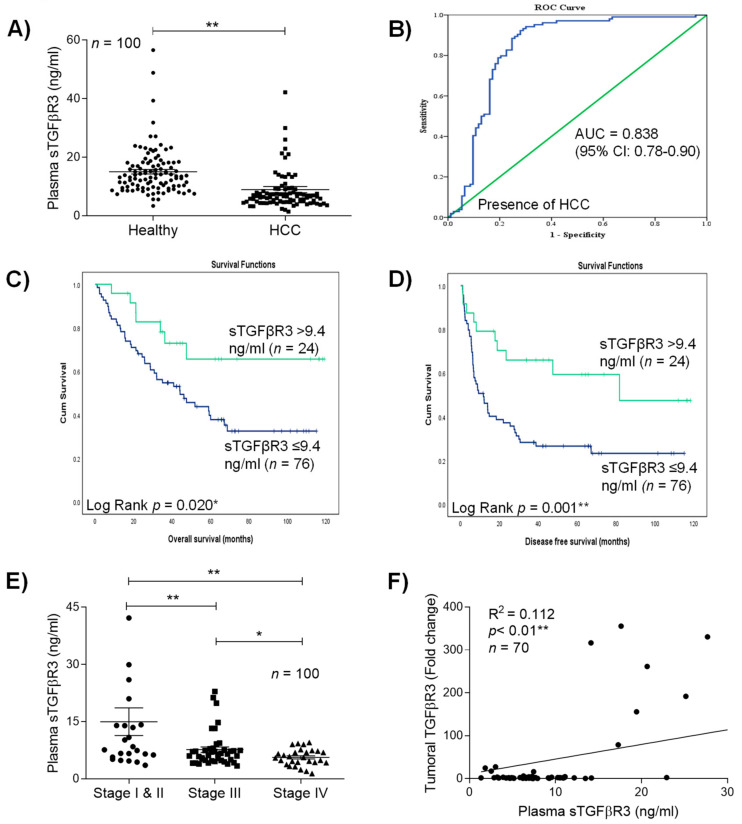
Figure 2.
Clinical significances of sTGFβR3 down-regulation in HCC plasma. (A) ELISA analysis of plasma sTGFβR3 in patients. (B) Receiver operation characteristics (ROC) curve analysis. The clinical values were accessed by differentiation of 100 preoperative HCC patients from 100 healthy individuals. The AUC was 0.838 ± 0.032 (p < 0.01). (C,D) Kaplan–Meier analysis of overall survival and disease-free survival in HCC patients associated with the plasma level of sTGFβR3. (E) Level of sTGFβR3 in patients with different tumor stage. (F) Correlation between tumoral TGFβR3 and plasma sTGFβR3. * p < 0.05, ** p < 0.01. Error bar indicated SEM. (Unpaired t-test for Figure 2A, E) (Chi-square test for Figure 2F) (Log rank test for Figure 2C,D).

