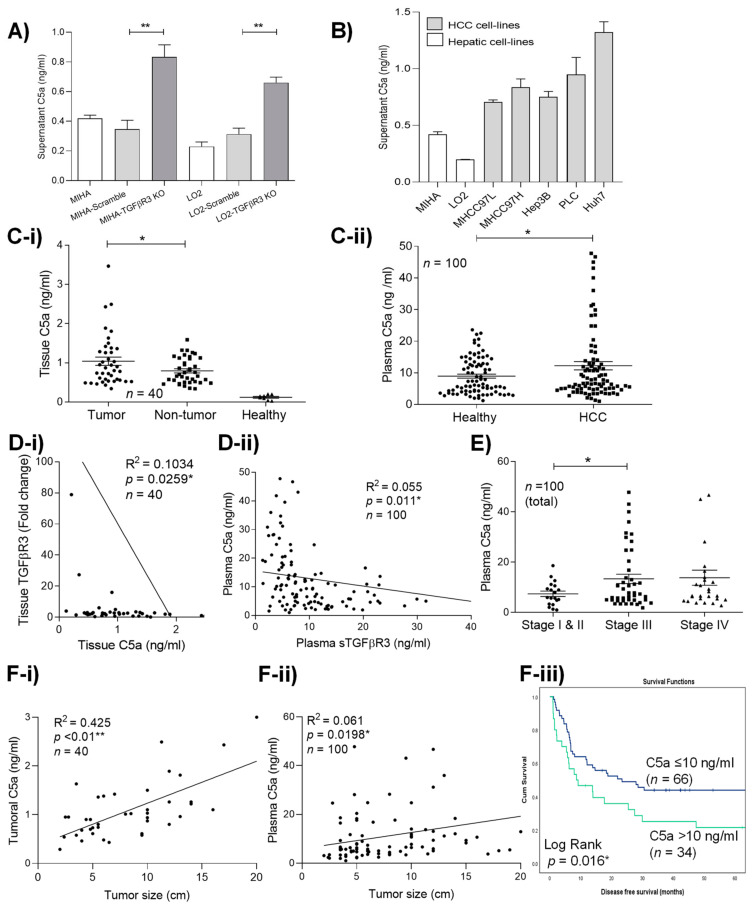
Figure 4.
Loss of TGFβR3 induced the upregulation of C5a in HCC. (A) TGFβR3 transcript analysis of two non-HCC hepatocyte cell lines, MIHA and LO2, knock-out by CRISPR/Cas9 (MIHA-TGFβR3 KO) and (LO2-TGFβR3 KO). Level of secretory C5a in (B) hepatocyte and HCC cell lines. (C-i) Tumoral, adjacent non-tumoral and healthy liver tissue, (C-ii) healthy and HCC patients’ plasma. (D-i) Correlation analysis of tissue TGFβR3 and C5a. (D-ii) Correlation analysis of plasma C5a and sTGFβR3. (E) Level of plasma C5a HCC patients with different tumor stages. Correlation analysis of tumor size with the level of (F-i) tumoral and (F-ii) plasma C5a. (F-iii) Kaplan–Meier analysis of disease-free survival in HCC patients associated with plasma C5a. * p < 0.05, ** p < 0.01. Error bar indicated SEM. (Unpaired t-test for Figure 4A,B,C,E) (Chi-square test for Figure 4D,Fi-ii)(Log rank test for Figure 4Fiii).

