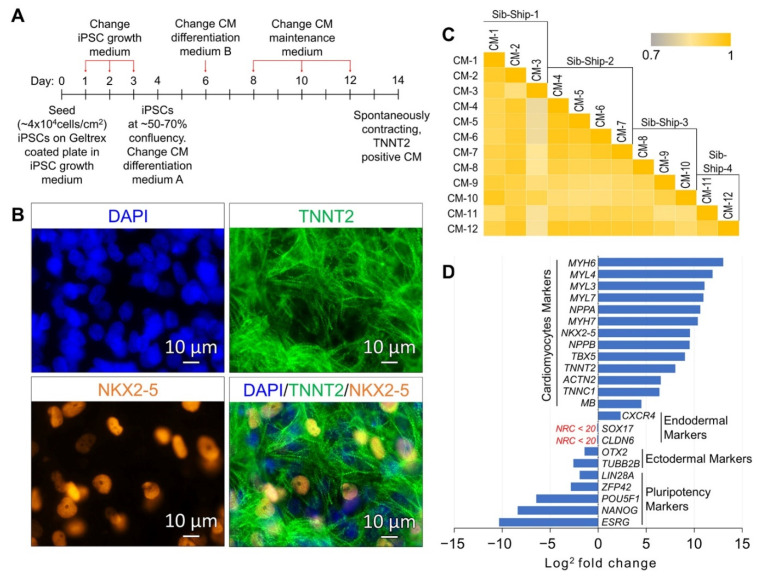
Figure 1.
Characterization of induced pluripotent stem cell (iPSC)-generated cardiomyocytes (CMs) by ICC and gene expression analysis. (A) Schematic diagram outlining the protocol of iPSC to CM differentiation. (B) A representative ICC image panel of iPSC-generated CMs showing expression of the CM markers NKX2-5 and TNNT2. (C) Correlation coefficient (r2) plot based on the 12,280 genes found expressed (NRC ≥ 20) in 12 iPSC-generated CMs. (D) Gene expression plot showing average differential expression of cardiomyocytes, pluripotency, ectodermal, and endodermal markers between 12 iPSCs and their generated 12 CM lines.

